Detecting Land Abandonment in Łódź Voivodeship Using Convolutional Neural Networks
by
 , , , and
Stanisław Krysiak
1,† ,
,
Elżbieta Papińska
1,†,
Anna Majchrowska
1,†,
Maciej Adamiak
2,*,† and
and
Mikołaj Koziarkiewicz
2,† 1
Department of Physical Geography, Faculty of Geographical Sciences, University of Lodz, 90-139 Łódź, Poland
2
SoftwareMill, 02-791 Warsaw, Poland
*
Author to whom correspondence should be addressed.
†
These authors contributed equally to this work.
Land 2020, 9(3), 82; https://doi.org/10.3390/land9030082
Submission received: 6 February 2020
/
Revised: 9 March 2020
/
Accepted: 11 March 2020
/
Published: 13 March 2020
Abstract
:The wide availability of multispectral satellite imagery through projects such as Landsat and Sentinel, combined with the introduction of deep learning in general and Convolutional Neural Networks (CNNs) in particular, has allowed for the rapid and effective analysis of multiple classes of problems pertaining to land coverage. Taking advantage of the two phenomena, we propose a machine learning model for the classification of land abandonment. We designed a Convolutional Neural Network architecture that outputs a classification probability for the presence of land abandonment in a given 15–25 ha grid element by using multispectral imaging data obtained through Sentinel Hub. For both the training and validation of the model, we used imagery of the Łódź Voivodeship in central Poland. The main source of truth was a 2009 orthophoto study available from the WMS (Web Map Service) of the Geoportal site. The model achieved 0.855 auc (area under curve), 0.47 loss, and 0.78 accuracy for the test dataset. Using the classification results and the Getis–Ord Gi* statistic, we prepared a map of cold- and hotspots with individual areas that exceed 50 km2. This thresholded heatmap allowed for an analysis of contributing factors for both low and intense land abandonment, demonstrating that common trends are identifiable through the interpretation of the classification results of the chosen model. We additionally performed a comparative field study on two selected cold- and hotspots. The study, along with the high-accuracy results of the model’s validation, confirms that CNN-type models are an effective tool for the automatic detection of land abandonment.

1. Introduction
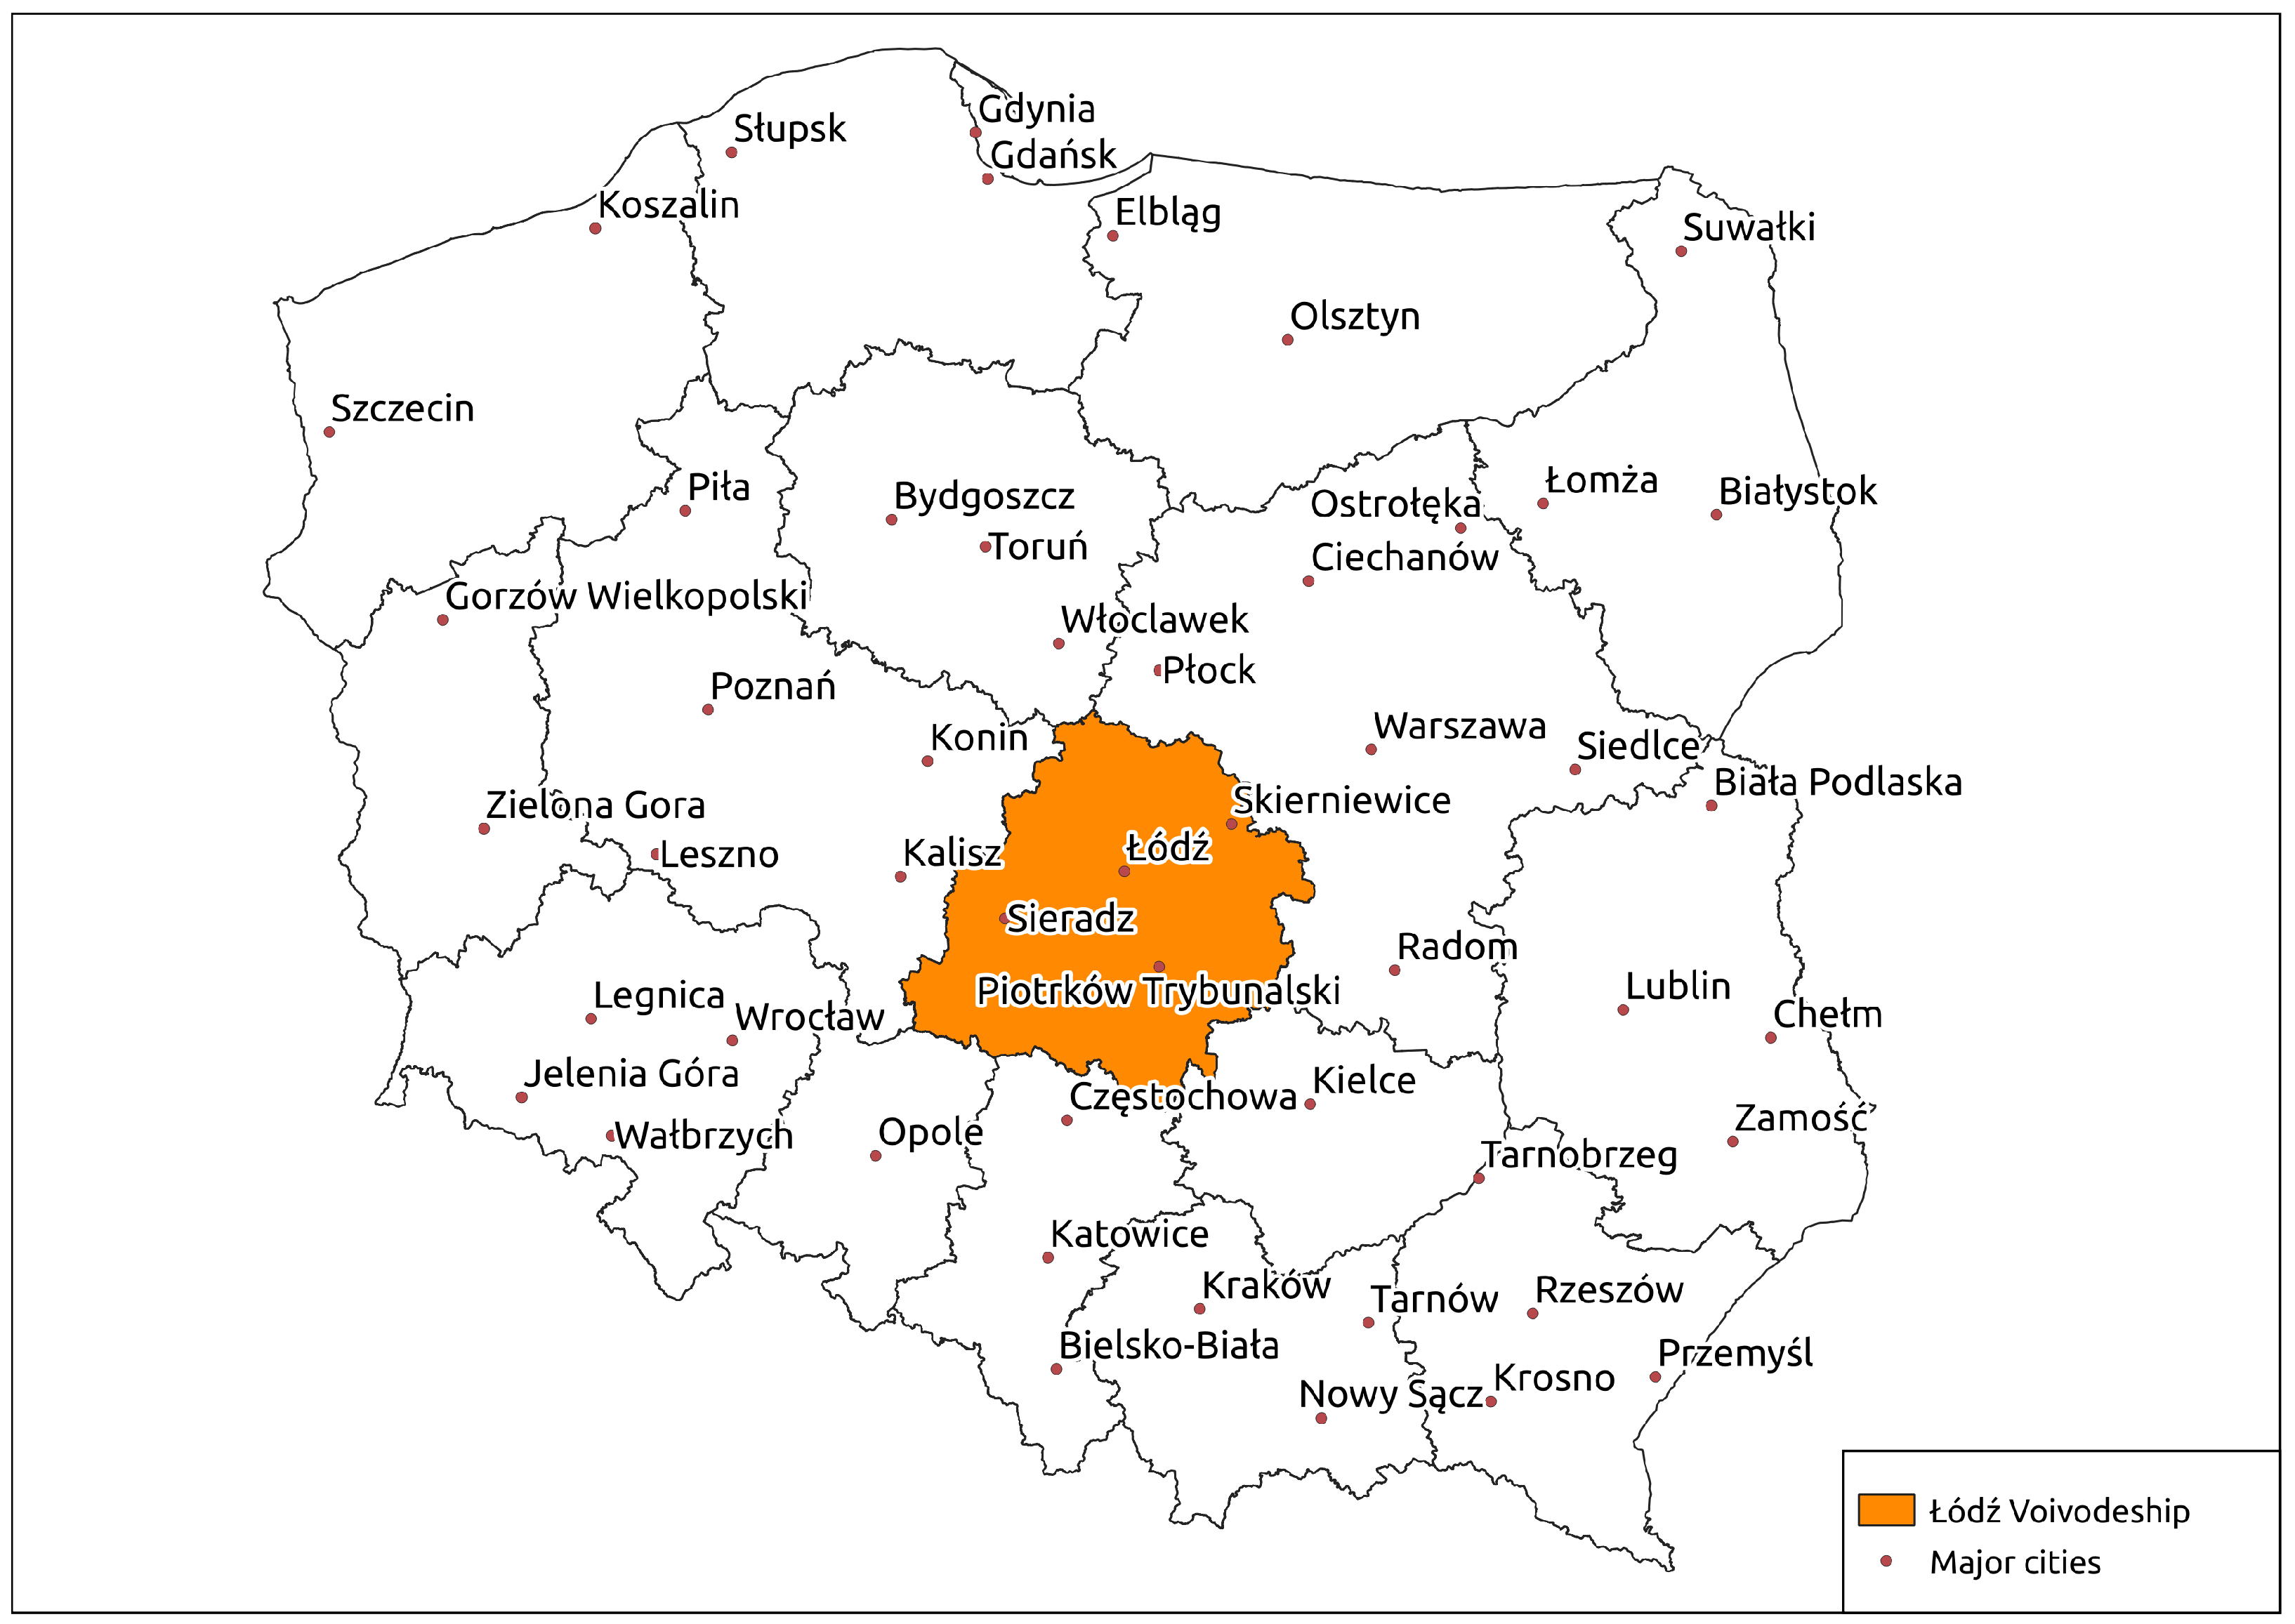
The rural landscape of the Łódź Voivodeship (Figure 1), as everywhere else in Poland, underwent massive structural and functional transformations because of the political upheaval of 1989–2000, followed by the country’s integration with the European Union [1,2]. However, this restructuring process was beset with contradictory phenomena. On the one hand, high-quality land was subjected to more intensive agriculture, resulting in more modern farming methods and the expansion of cultivated areas. On the other hand, mid- and poor-quality land experienced the emergence of substantial areas subject to agricultural abandonment [3]. Statistics Poland (GUS) reported an increase from 1.3 to 1.8 mln ha of fallow and abandoned lands in the year 1995 alone [4], further expanding, according to the official Agricultural Census of 2002, to 2.3 mln ha, or 17.6% of total arable land in Poland [5]. Reasons for the reduction in agricultural activity include the progressive urbanization of rural areas (most prominently in suburban zones), declining returns on agricultural production (primarily affecting individual agricultural holdings operating in poor-quality areas), and the decline of cattle and sheep husbandry, leading to agricultural abandonment of meadows and pastures [6,7].
With the availability of direct agricultural subsidies under the so-called Good Agricultural and Environmental Conditions (GAEC), many farmers decided to resume their activities, resulting in a marked decrease in abandoned lands. Currently, however, it is impossible to determine the scale of this phenomenon because of a lack of relevant statistical data. Specifically, in the Agricultural Census of 2010, fallow lands were folded into the category of “other farmlands”, while the Agricultural Census of 2010 report on Land Utilization [8] did not include the term “abandoned land”. Furthermore, by a 2001-03-29 ordinance of the Minister of Regional Development, neither abandoned nor fallow lands constitute a unique category; instead, they are incorporated into the category of “arable land” [9]. In consequence, it has become impossible to estimate the amount of abandoned or fallow lands at any level of administrative subdivision [10,11].
A limited number of publications do include up-to-date maps documenting land abandonment. These necessitate field survey based on aerial photography. The amount of required effort and time for utilizing the aforementioned methods has limited its utility to smaller surfaces, such as catchment areas [12,13], test research areas [3,14,15,16], and landscape parks [17]. Such land abandonment intensity identification processes were also utilized on a single area of several thousand km2 on the basis of orthophoto analysis, supplemented by on-the-ground verification [18,19,20,21,22]. In recent decades, this approach to identifying land abandonment, in Poland and worldwide, has been increasingly augmented by the usage of satellite spectral imaging [23] and LIDAR data [24,25,26].
Abandoned fields, meadows, and pastures are subject to spontaneous plant regeneration and succession. According to J.B. Faliński [27], vegetation that grows in such a way can be described as “emancipated vegetation” or “liberated vegetation”, as in “freed” from the long-term influence of humankind. In other words, abandoned lands are areas regaining their vegetation coverage as a result of autonomous ecological processes. Frequently, abandoned lands become progressively floristically enriched with the passage of time, not infrequently including rare or endangered plant species [28]. From the conservationist point of view, postagricultural, spontaneously overgrowing areas factor in an increase in biological diversity, structural heterogeneity, the formation of ecological corridors, and the enrichment of sustenance opportunities for diverse animal species [17]. In fact, in the environmental conditions of central Poland, some areas of land abandonment visually resemble a forest stand. According to botanical observations, spontaneously appearing, newly forested areas are characterized by age and species diversity, correlated to their local habitat and soil fertility [29,30]. Thus, emergent new plant communities provide a positive environmental influence and are a costless alternative to aforestation [10,19].
Regions of land abandonment, typically undergoing varying degrees of plant succession, intermingled with the open spaces of fields, meadows, and pastures, create vistas of considerable visual allure [31]. For this reason, as well as a societal interest in rural expanses as recreational spaces, these areas have found themselves under both sparse and dense “vacation settlements”. In addition, dubbed “tourist colonization”, the process was especially intensified along river valleys and in the vicinity of the shoreline of flood control reservoirs [32,33]. This was helped along by the progressive decline in crop- and livestock-related agricultural usage [34,35]. As a consequence, abandoned lands are often accompanied by seasonal homes and allotments [31].
The principal goal of our study is to evaluate the potential of deep learning, specifically Convolutional Neural Networks (CNNs), to accurately classify land abandonment and provide new insights into the origins of the process, especially in the context of the Łódź Voivodeship. The decision to utilize CNNs over traditional methods, such as Support Vector Machines (SVM) or fully connected artificial neural networks, is the former’s ability to encode complex image features. This capability is due to the use of convolutional filters that, in the process of training, gain the ability to detect the presence of specific patterns. Furthermore, the convolution operation, which is the backbone of CNNs, offers a performance gain when training the networks on Graphical Processing Units (GPUs). This, in consequence, offers the potential for training the model on larger datasets and feasibly experimenting with various hyperparameter values and network architectures. The application of CNNs to solve computer vision problems, particularly classification, has proven to be a valid and effective approach and become an industry standard. Because of their effectiveness in recognizing complex features and their usefulness when processing high-dimensional data, CNNs have also been successfully deployed in land coverage classification with satellite and aerial imagery [36,37,38,39,40]. We formulate the following hypothesis: an appropriately prepared Convolutional Neural Network (CNN) is able to detect land abandonment within the Łódź Voivodeship to a recognizable degree when compared with sources of truth, such as on-the-ground studies from various time periods.
2. Materials and Methods
2.1. Background
Deep learning in general and Convolutional Neural Network (CNN) architecture in particular have proven revolutionary in essentially all fields that can be assisted by computer vision, and the subfield of land use classification proves to be no different. CNN-based approaches do possess a major disadvantage in that they require a substantial amount of data for the training process. Fortunately, as noted in [36], considerable quantities of image data have become available in recent years thanks to deployments of satellites such as Landsat 8 and Sentinel-2 A/B. This temporal correlation becomes quite apparent when studying the relevant literature, as the bulk of published research concerning the usage of CNNs for land cover classification dates from 2017 or later, i.e., following the deployment of Landsat 8 [38] and Sentinel-2A [39]. Earlier works, however, exist in a limited number, and they have simply utilized other datasets, such as KSC/Pavia [40] and UC Merced [41].
In concert with the availability of data, the architecture has developed, as well. Earlier approaches favored a combination of established methods, such as Principal Component Analysis (PCA) and logistic regression [40] or Deep Convolutional Neural Network and Transfer Learning (DTCLE) [42]. Subsequent developments have favored the use of pure CNNs, with methods such as Random Forests (RF) and/or Support Vector Machines (SVM) only taken into account as baselines [36,43,44]. The majority of neural networks developed for the tasks of land classification appear to use a custom neuronal layer architecture. Very few exceptions exist, such as one solution based on AlexNet [45]. This focus on bespoke architectures can be explained by established network layer schemes that have been developed to handle generic object recognition tasks, such as various ImageNet editions [46,47]. Apart from the variability due to the number of convolutional layers, types of pooling, etc., three other network architectural trends can be distinguished.
The first is the split and/or filtering of spectral bands for the input vectors. This can range from over 180 [43] to 6 [44]. Generally, the preference seems to be to take both visible and infrared bands into account. This may be the result of data availability and the need to ensure interoperability between different data sources. A reduction in time and cost overheads is, in turn, a possible factor contributing to the selection of a limited set of bands with comparatively diverse characteristics.
The second categorization is closely related to the former, namely, the dimensionality of the neural networks. Most networks in the existing literature are either 1-D (e.g., [43]), where the focus is on the interaction of the spectral bands for a specific pixel, or 2-D (e.g., [48]), where the concentration is on the interplay between pixel values. Note that the “dimensionality” here pertains to the number of dimensions of a specific convolution kernel and not that of the input, which is 1 higher for a given value; i.e., a 2-D CNN receives a 3-D input that consists of sets of values, where k is the kernel size and n is the number of bands. One comparison of dimensionality vs. performance [36] determined that both approaches have comparable accuracies, with the 2-D CNN providing a slightly increased accuracy for the specific test dataset used.
The third distinction also deals with dimensionality but along the temporal axis, specifically to distinguish data that is time-invariant versus time-variable. Of special note here is the use of a Long Short-Term Memory (LSTM) network in [44]. LSTM networks have a deep learning architecture in which the antecedent output influences subsequent input, both over short and long intervals, in order to capture features variously localized in a given linear dimension, such as time (LSTMs also find use in natural language analysis). In particular, in [44], it was found that LSTMs can offer accuracy improvements over at least some variants of CNNs. On the other hand, it has been demonstrated that even a CNN can benefit from time-variable data [43].
An important portion of any machine learning experiment is data preprocessing and preparation. Deep learning networks allow for some simplifications in that regard, as they automatically handle several steps necessary in “classic” machine learning methods, such as feature extraction. However, some problems are unavoidable, even with this type of intrinsic automation. In the area of land cover classification, special relevance is placed on compensating for missing data, resulting mostly from cloud cover but also from factors such as intermittency of satellite coverage. Apart from situations in which a cloud mask is provided [36], methods range from applying a cleanup with Self-Organizing Kohonen Masks (SOM) [36], through using separate CNNs [49], to simply utilizing images of the same area, captured on multiple days, as supplementary input [43].
Finally, an aspect of the existing literature that is extremely relevant to our own research is the specifics of how land cover classification categories can be selected and delineated. In general, every deep-learning-based approach encountered was trained for multiple classes, ranging from 11 [36] to even 21 [41]. However, invariably, most of these classes were oriented toward crop types, and no classification corresponding to our definition of land abandonment could be found. Interestingly, multiple articles identified problems with noncrop classes, such as meadows, uncultivated areas, and fallow lands used for active farming [44,50,51]. In particular, the approach in [44] netted a precision of around 0.46 for LSTM and 0.25 for CNN for the fallow class, compared with ones exceeding 0.85+ for other classes. This demonstrates the existence of a niche for neural network models specializing in the classification of areas not under active agricultural cultivation.
2.2. Data and Model Preparation
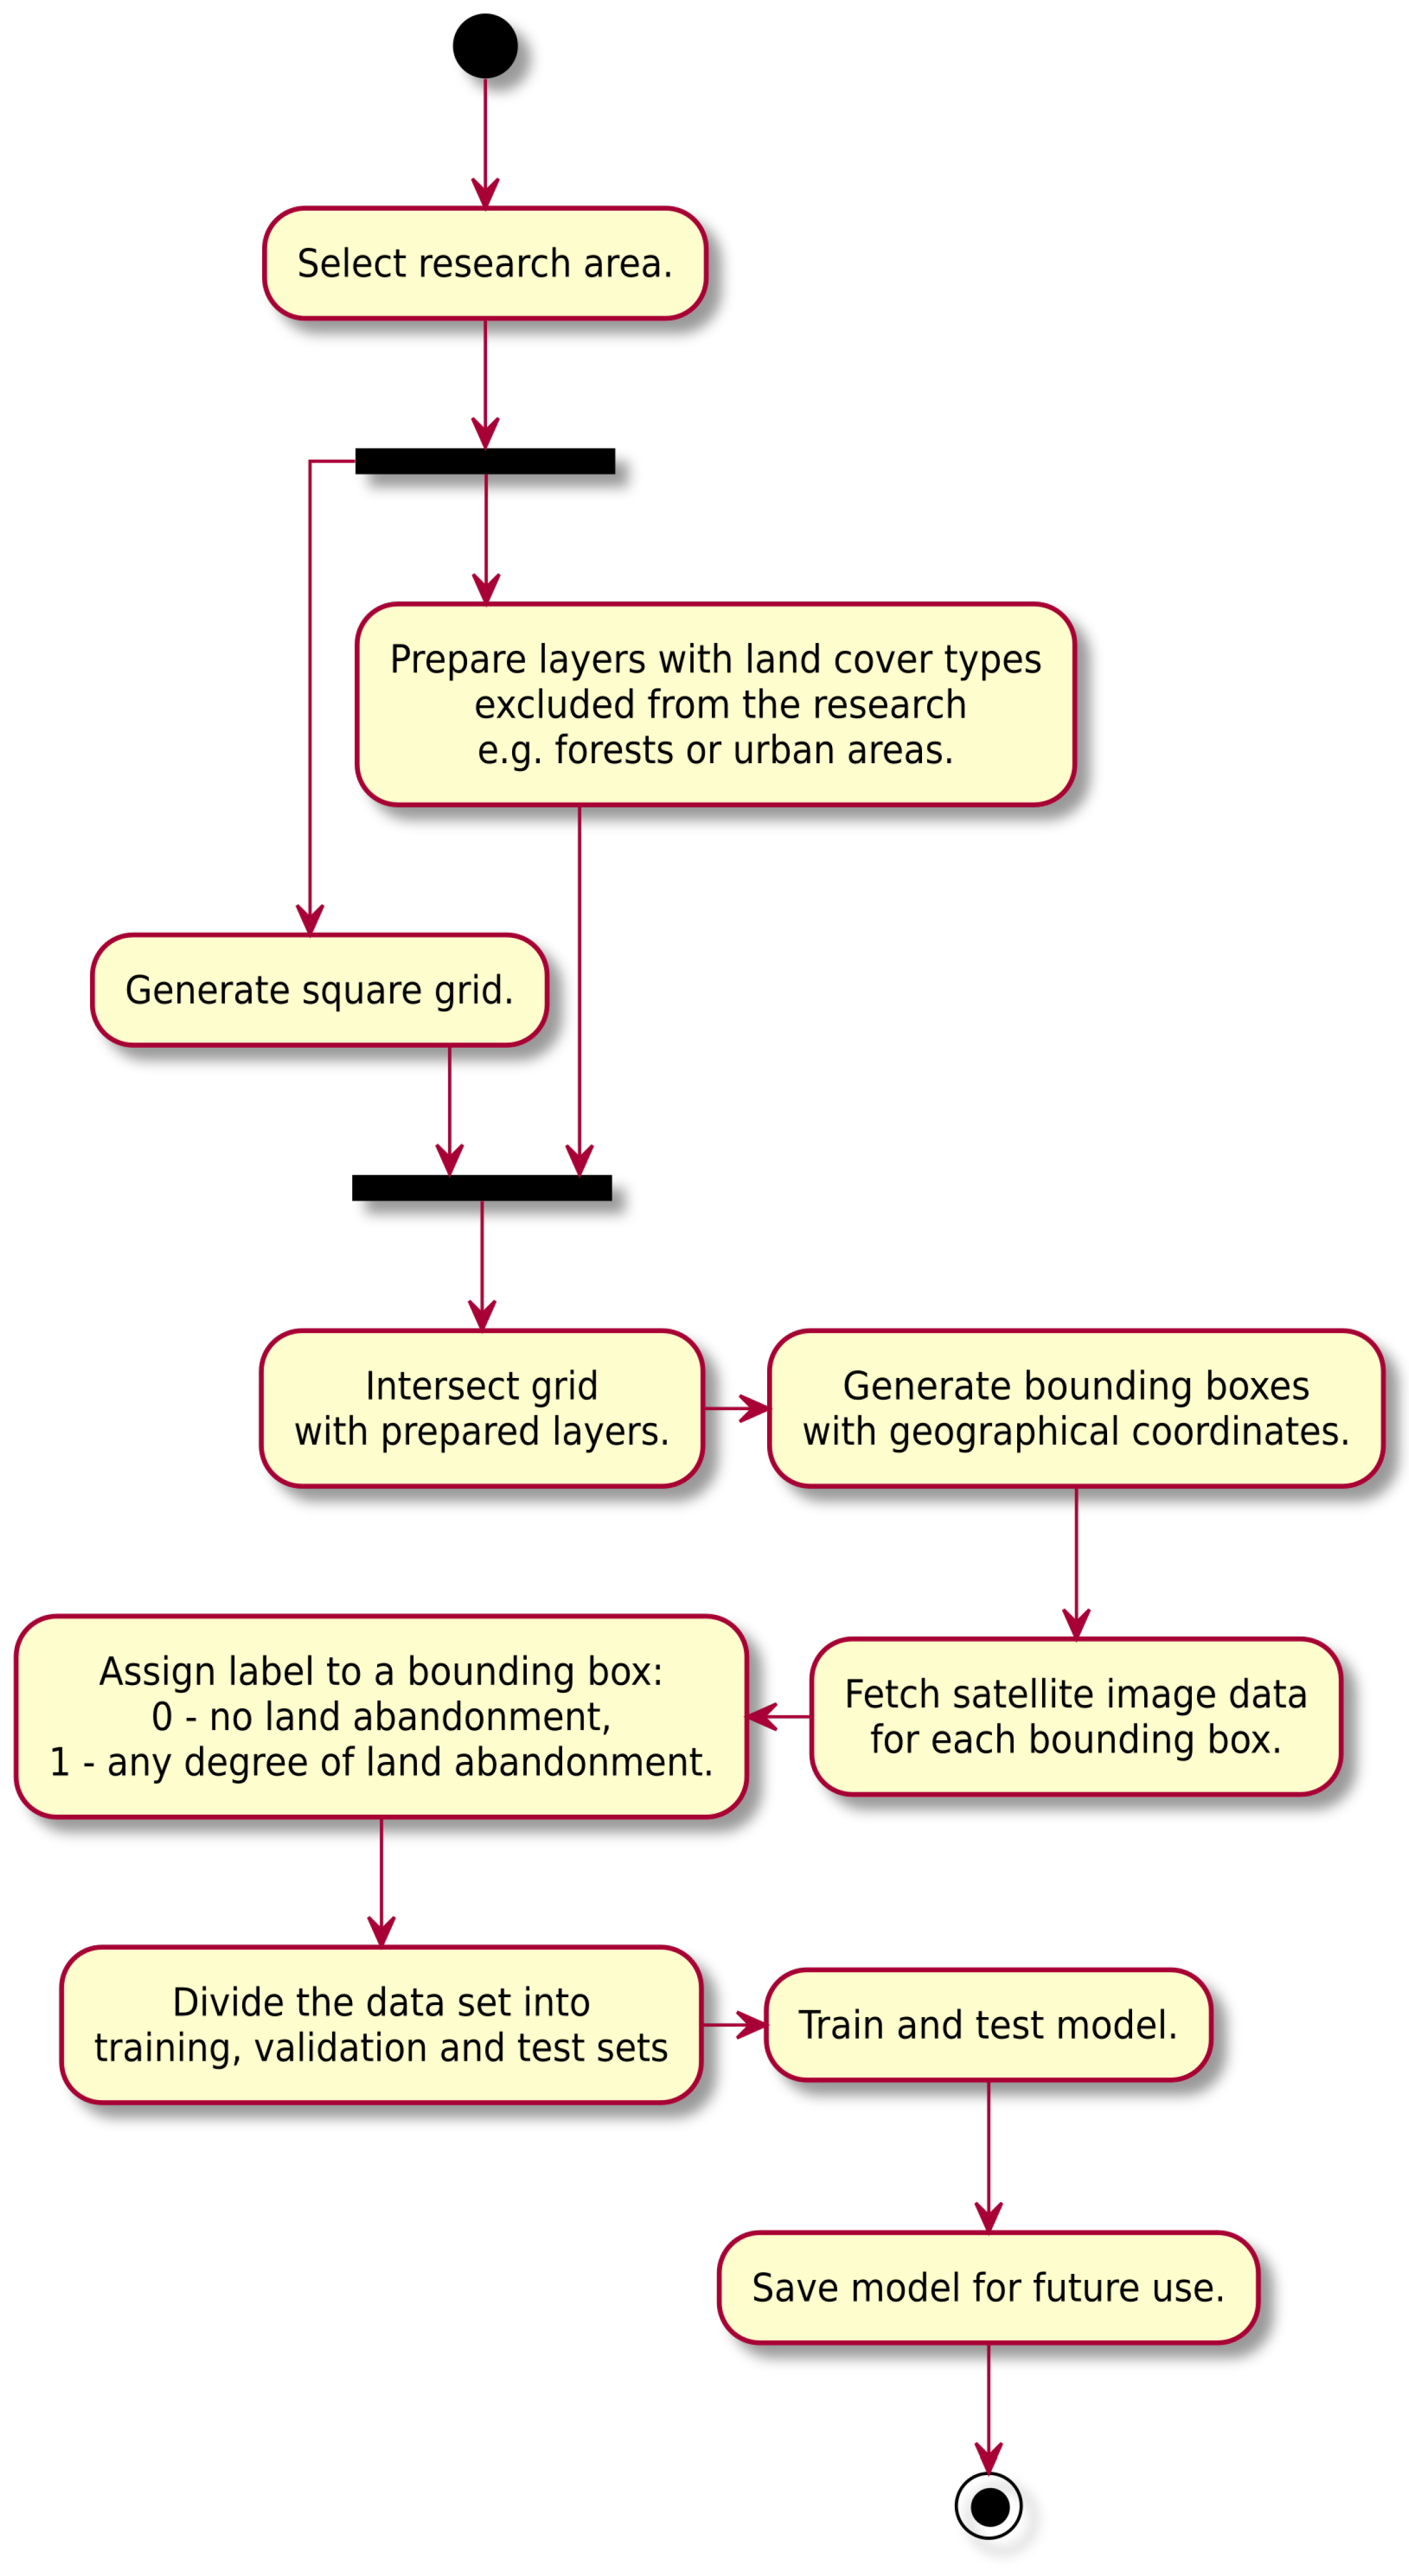
As is standard with deep learning image classification, we divided the research area into grids. The fundamental grid element comprises a rectangle of variable dimensions, limited by the following constraints: a maximum area of 25 ha and a maximum edge length of 500 m. Grid elements are segmented by superimposing an EPSG:4326 square grid and defining the origin at the northwestern corner of the rectangle delineating the given research area. Subsequently, the grid is adjusted to conform to the source classification data for the chosen machine learning model, as well as to the collection and processing procedures that generate the input vector used for the learning and prediction process. These adjustments, in turn, effect the aforementioned deviations of edge length and area. The complete model training process is depicted in Figure 2.
The research proper was initialized by preparing a classification dataset, which is necessary when defining training, test, and validation data for the statistical learning system. The authors based their work on prior research efforts during “The ecological role of abandoned agricultural lands in buffer zones around landscape parks in the Łódź Voivodeship” project, financed by the Polish National Science Centre (1760/B/P01/2011/40).
As part of a preliminary study, the research team analyzed the buffer zones of the relevant landscape parks to categorize them into a 5-point scale of land abandonment intensity. In 25% intervals, the scale progresses from 0% (1) to 100% (5) of abandoned land that covers the given area. The classification process was based on a visual evaluation and interpretation of orthophotos dating from 2009, available through the WMS (Web Map Service) of the Geoportal site [52]. The resultant initial dataset contains 33,692 grid elements encompassing 8423 km2, 46.2% of the voivodeship’s total area.
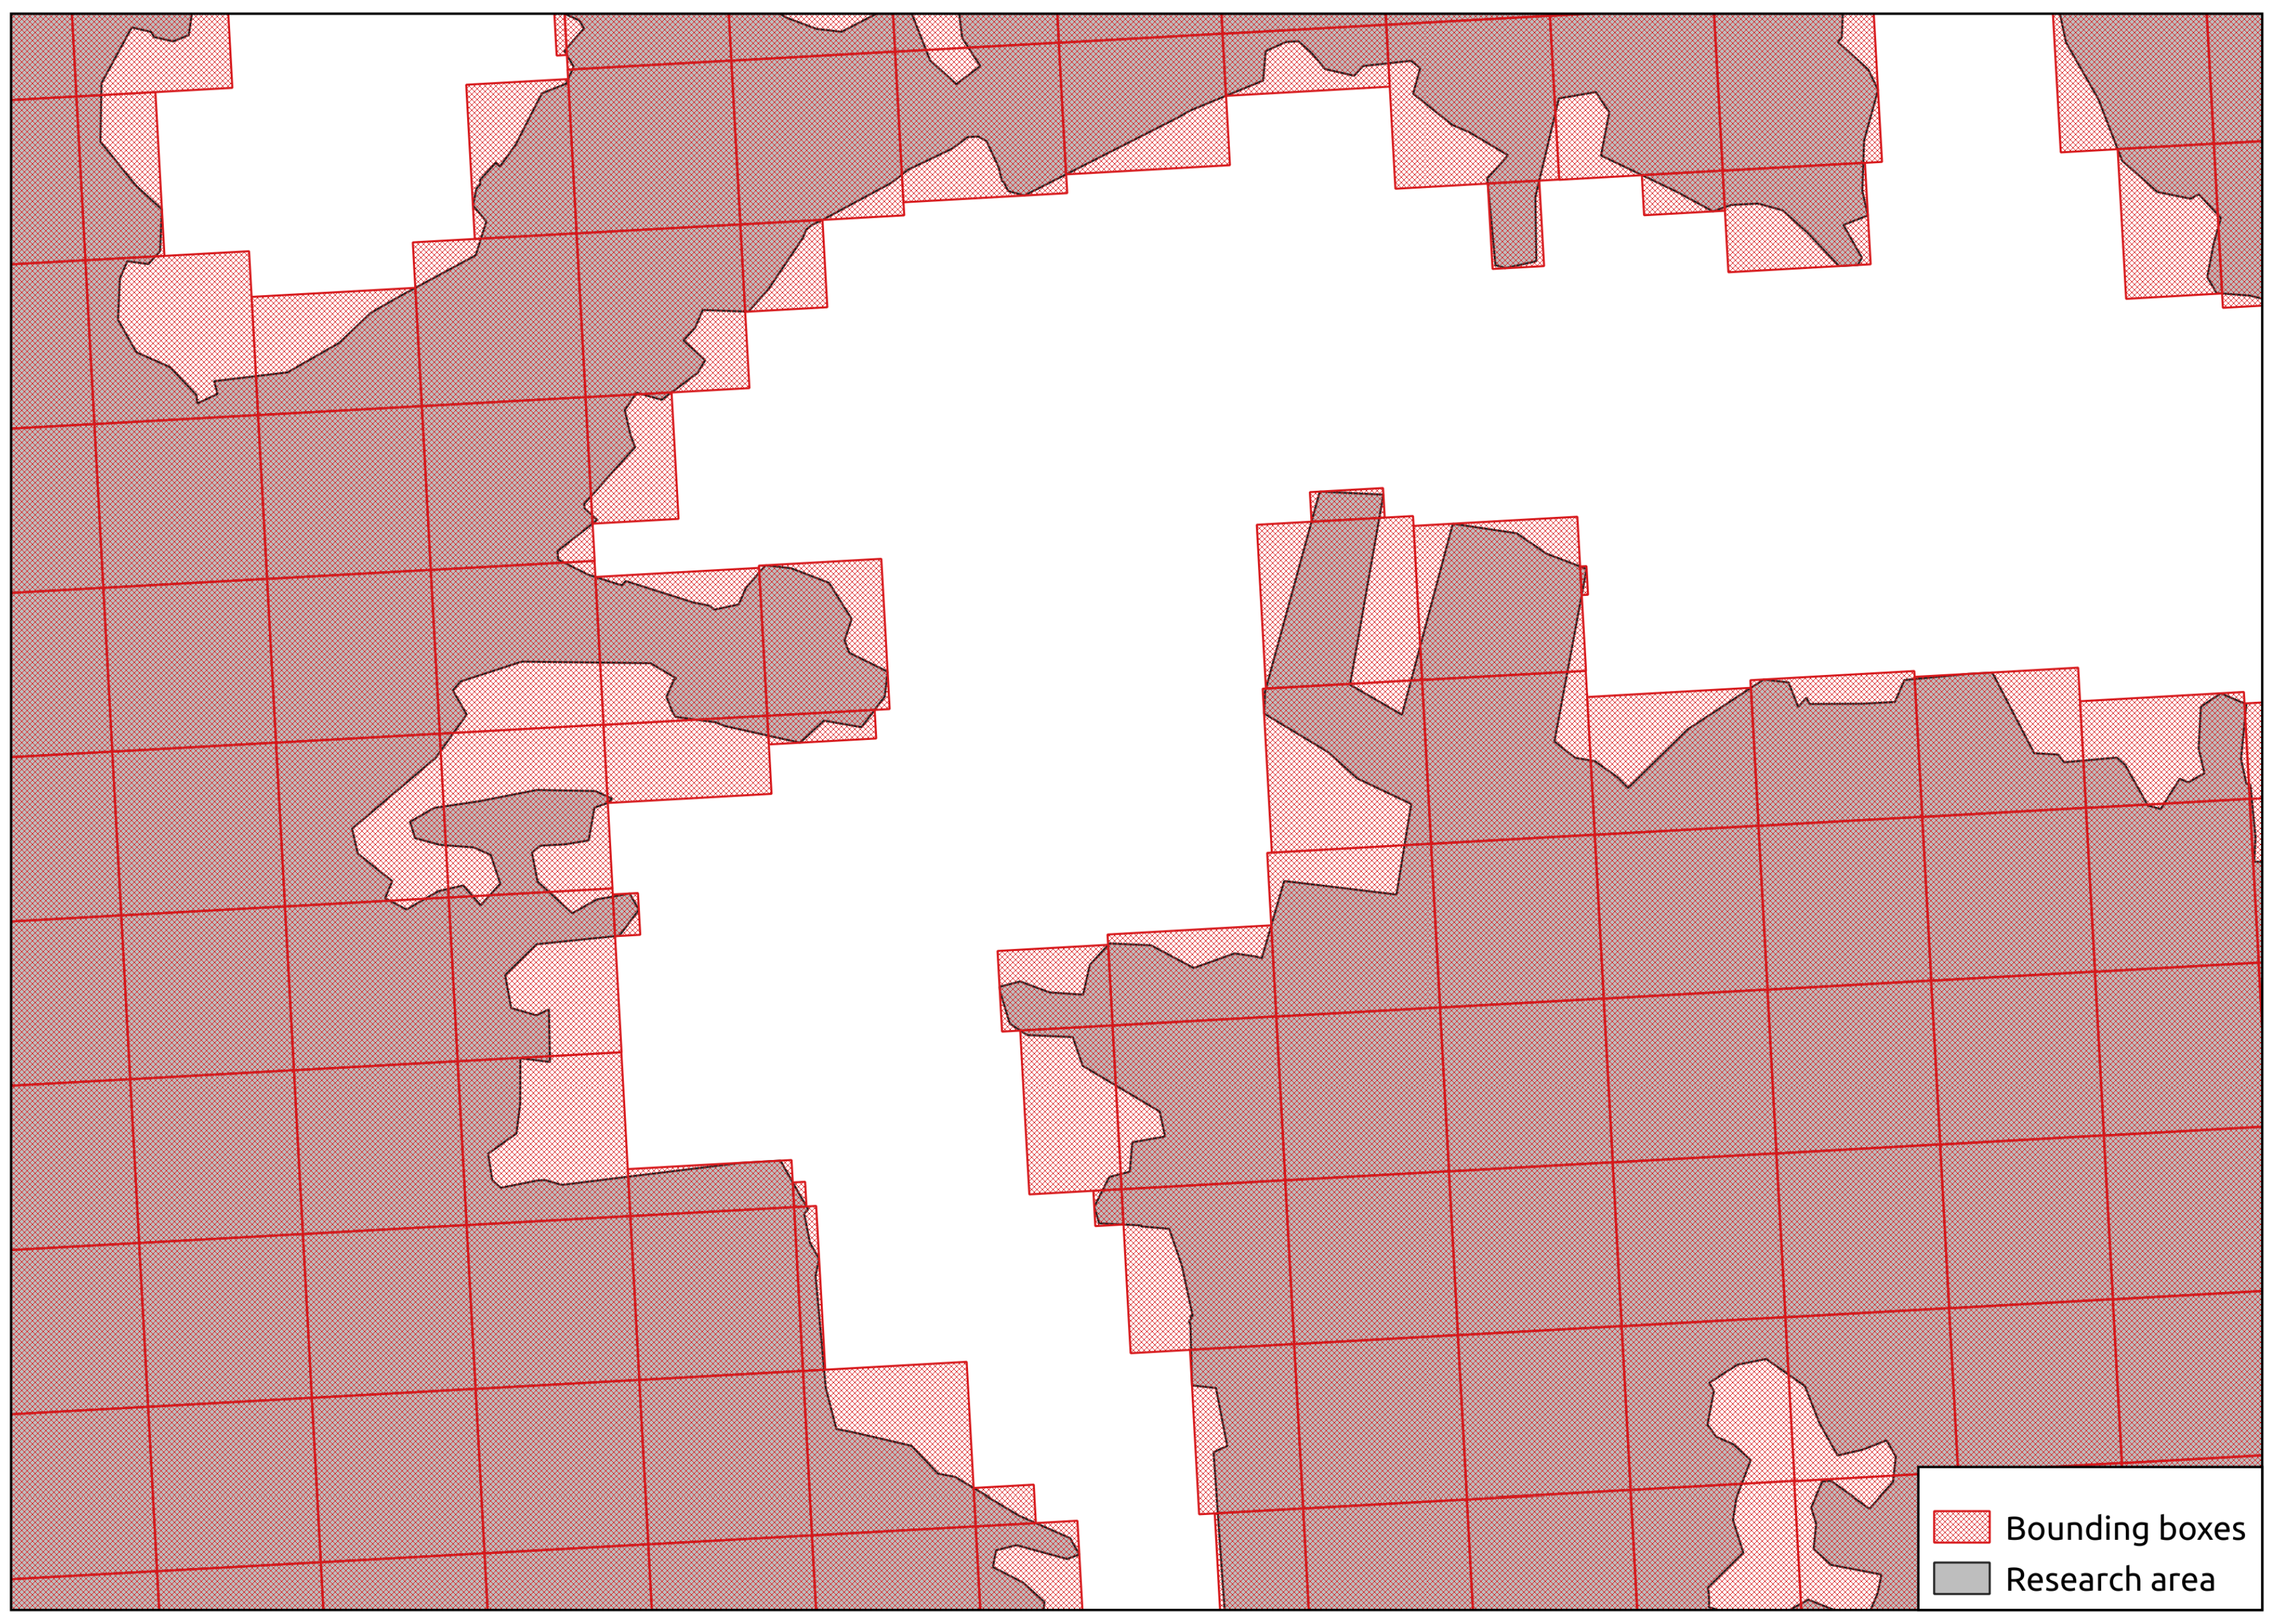
In practice, however, the research coverage was more limited, as a portion of the grid elements was located within the 10 km landscape-park buffer zones and/or intersected features, such as forests and inland waters. These factors limited the effective classification area of the relevant grid elements and resulted in the conversions of these areas from portions of a square grid to more complex and occasionally concave polygons. A related consequence is the degeneration of some grid elements, even to the point of reclassification as limited-area artifacts. The authors decided to overcome the outlined issues by, firstly, filtering areas to only include those in the range of 15–25 ha and, secondly, transforming complex polygon borders into their minimal bounding boxes (Figure 3).
Using QGIS 3.8.3, every thus transformed research area had its bounding shape coordinates normalized to the geographic latitude and longitude. Simultaneously, the class label was reduced to a binary space: 0 denotes no land abandonment (the null class) and 1 denotes any degree of land abandonment in the given area. The final classification dataset encompasses 13,328 rectangles of 3073.05 km2 in total, accounting for 16.87% of the total Voivodeship area. An average grid element measures 23 ha, with a standard deviation of 2.9 ha. The mode is 25 ha (half of all grid elements).
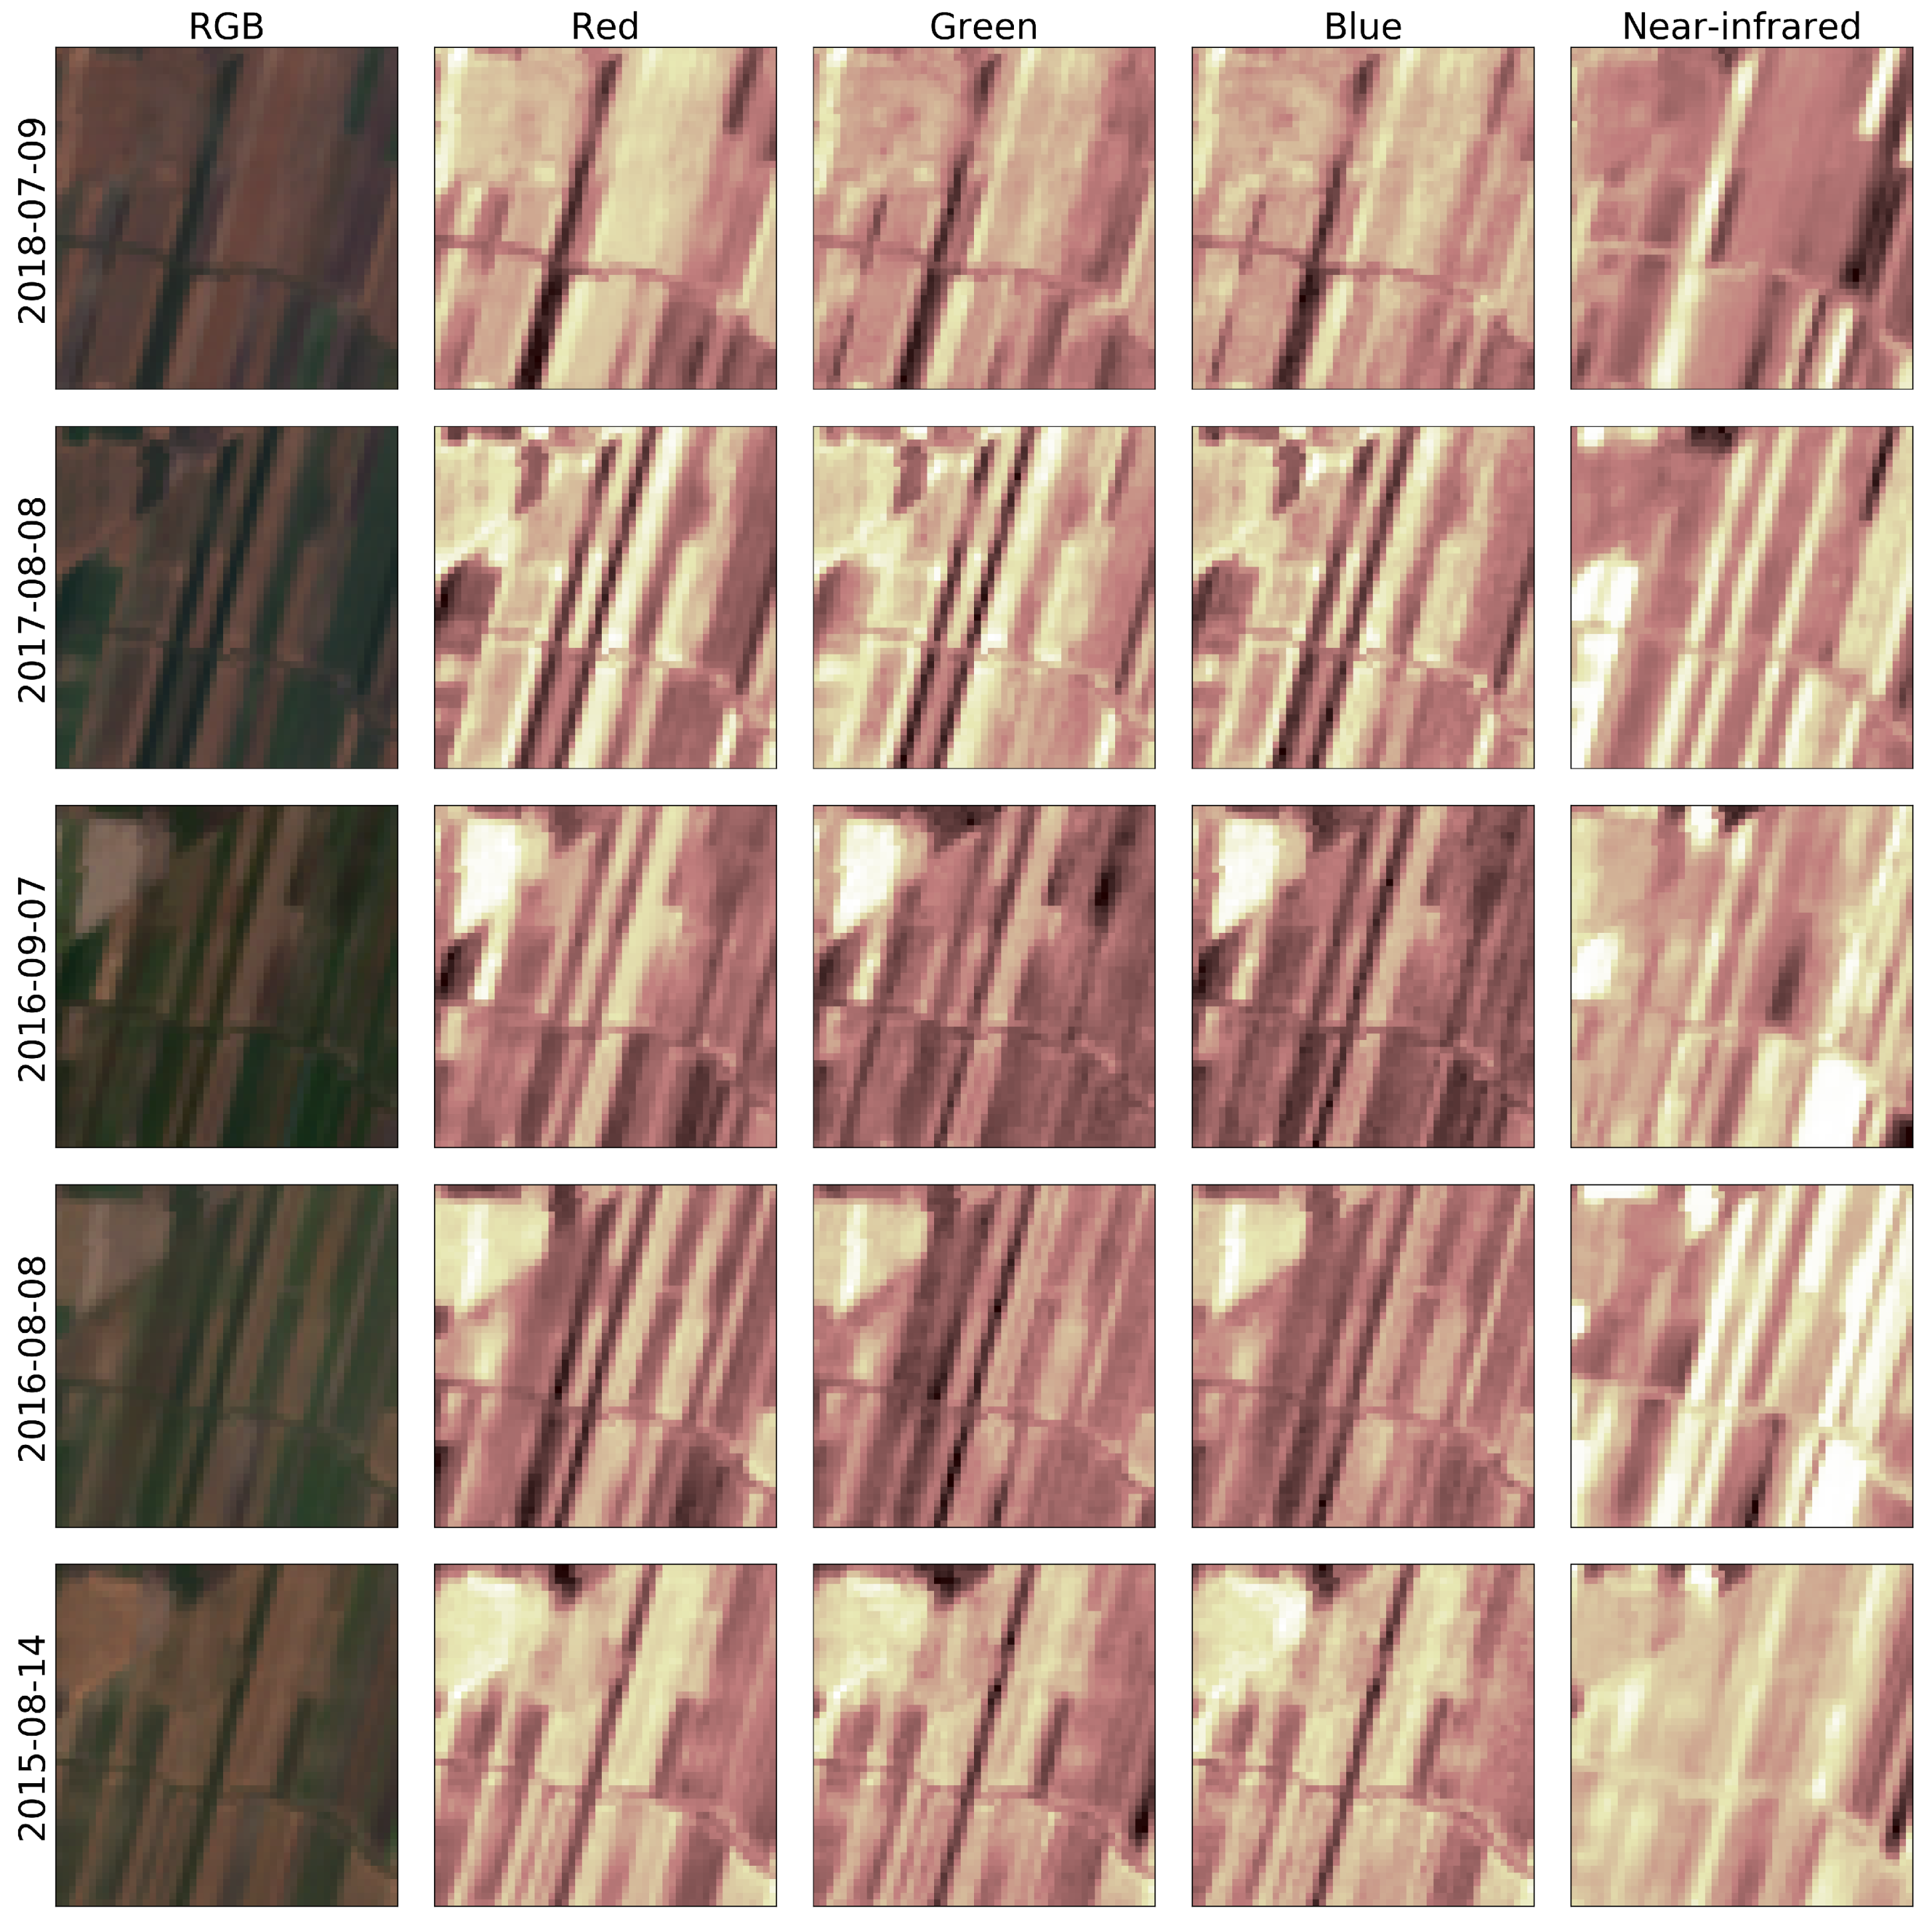
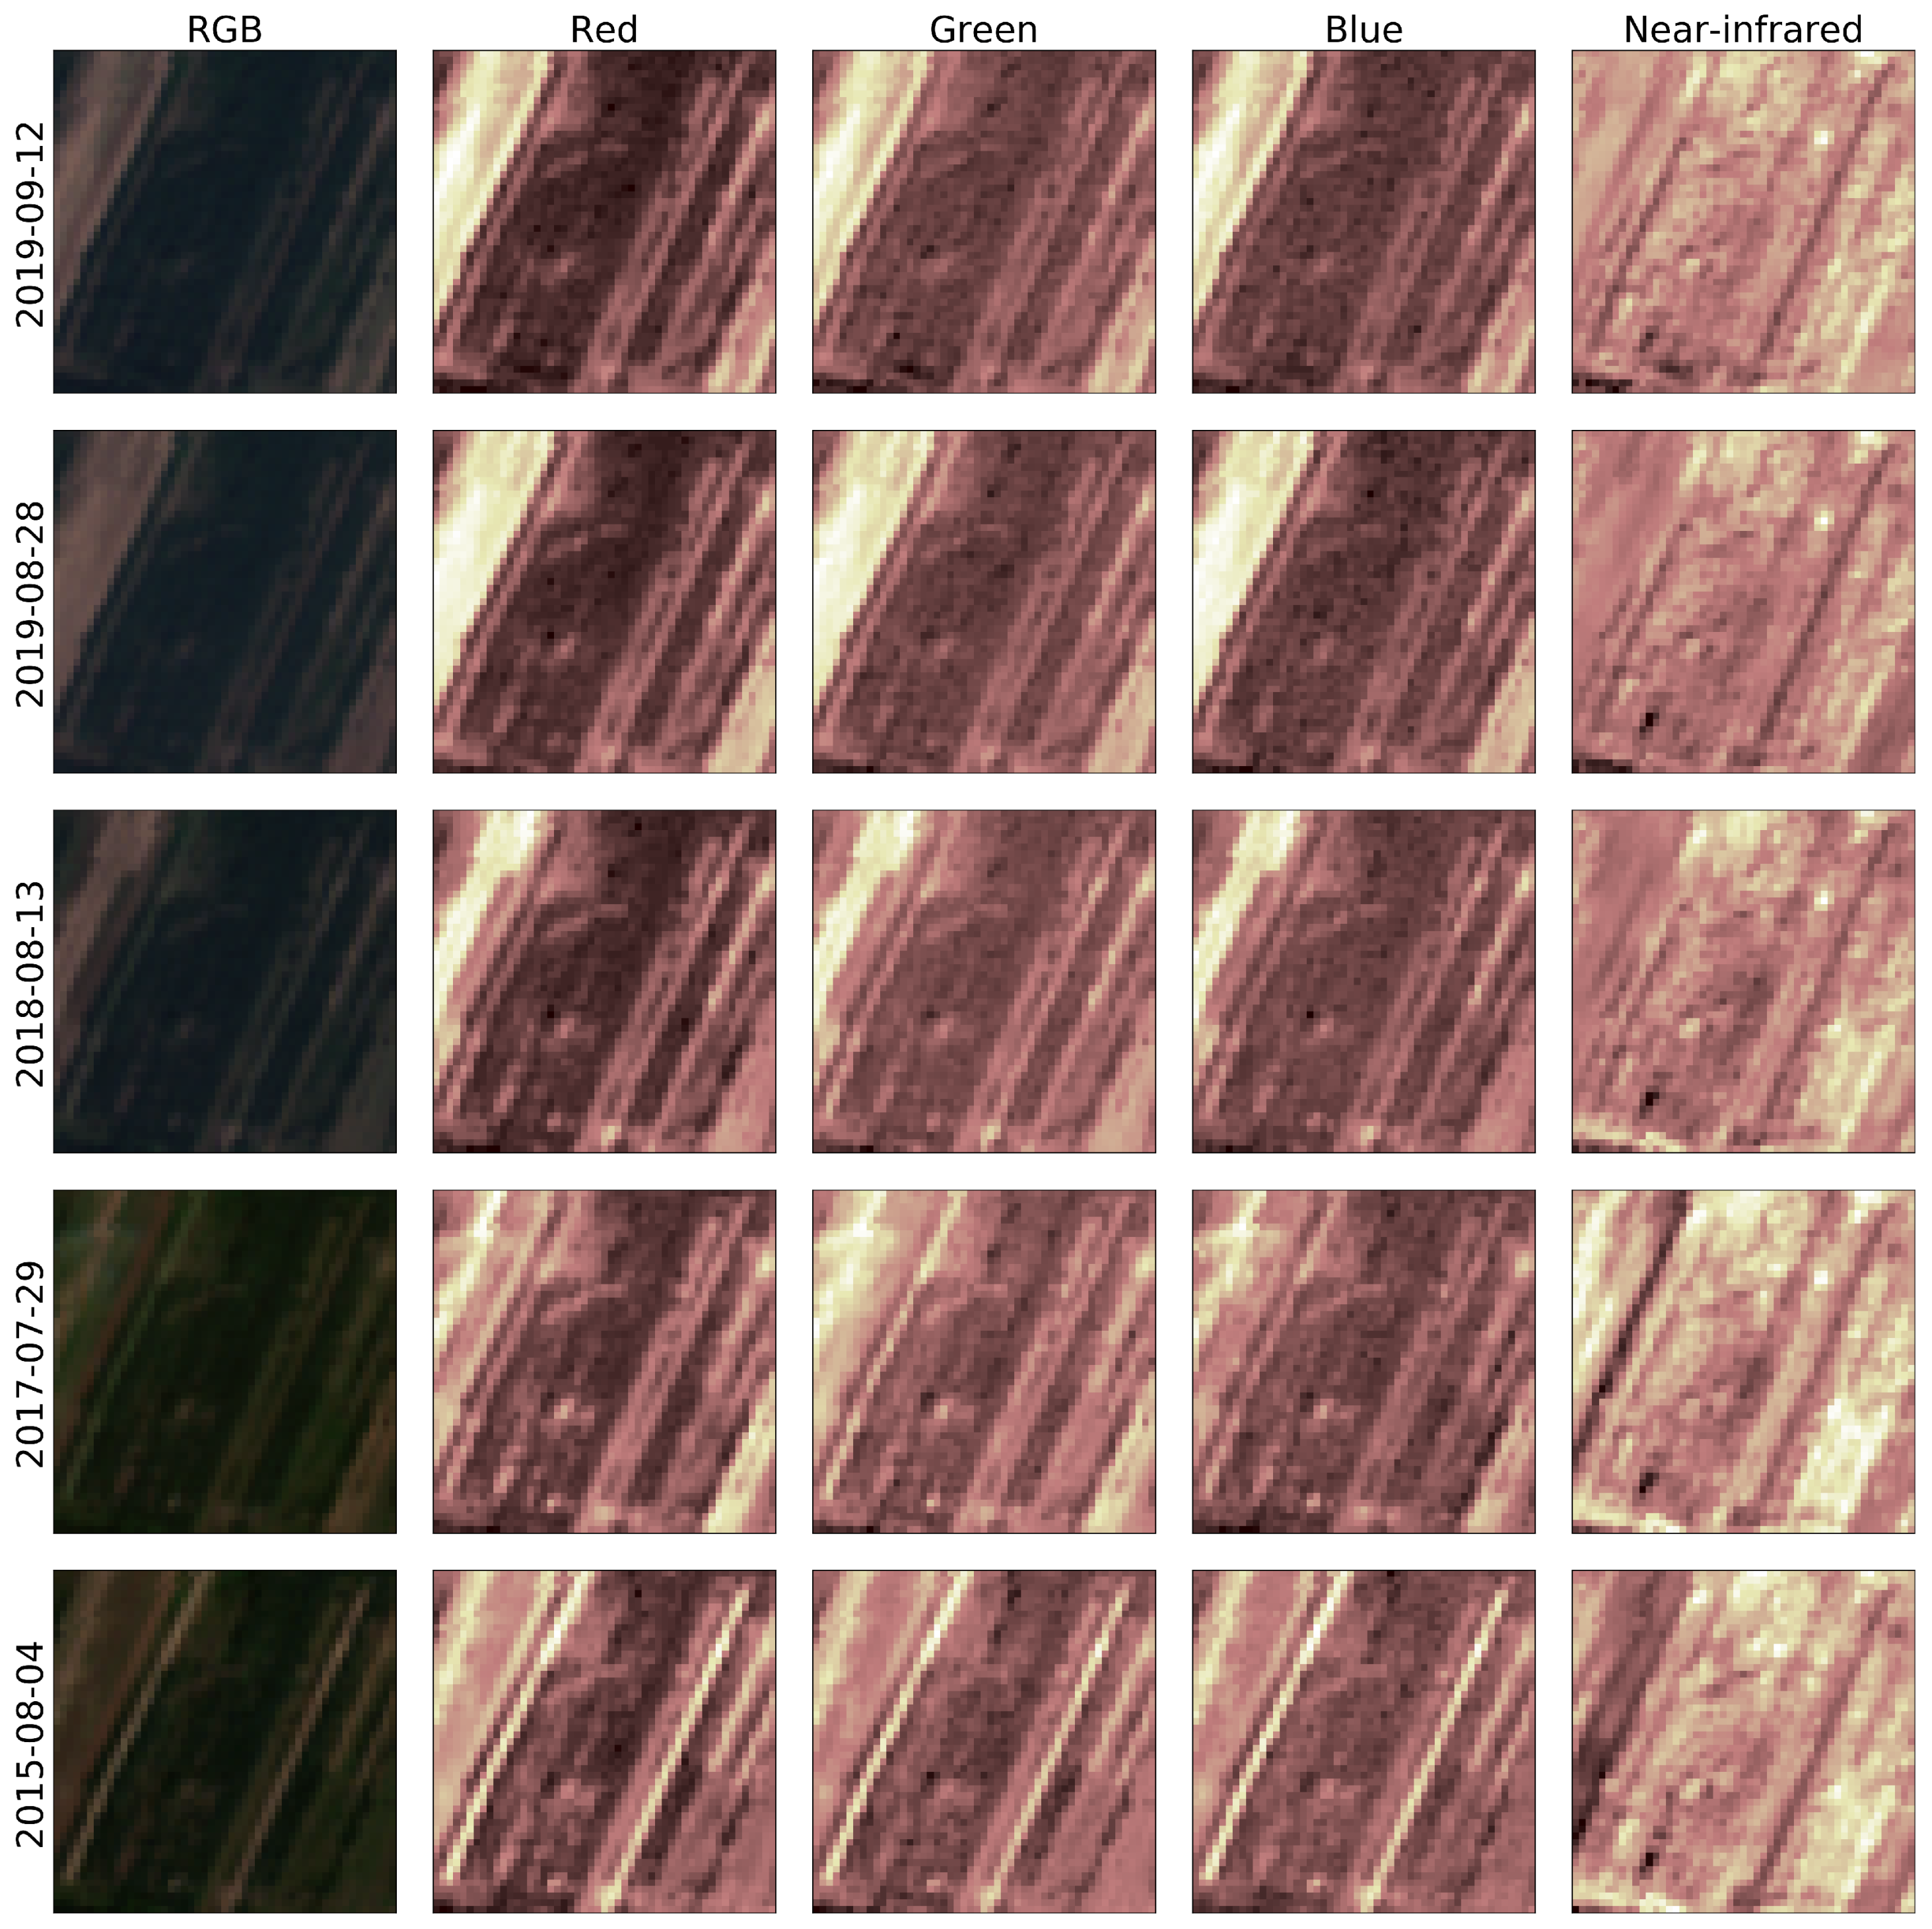
The classification dataset was enriched by imaging data from the Sentinel-2 satellite project by assigning a corresponding multiband TIFF file to each of the 13,328 grid elements (examples in Figure 4 and Figure 5). Data ingestion was accomplished via the Sentinel Hub database [53] and the sentinel-py library [54]. The referenced image set encompasses satellite imagery from 2015 until 2019, with cloud cover per element lower than 5%. Each image includes the following emission channels: near-infrared, red, green, and blue (B08, B04, B03, B02). A 10 m by 10 m square corresponds to a single pixel. Boundary areas and areas with less than 90% of themselves within the scanning zone were rejected. Nearest resampling was used to upsample every grid element to 50 px by 50 px with the help of the rasterio library. In the end, 445,671 files were ingested into a numpy array labeled with the corresponding class. The data were subsequently split into training (361,337 units), test (44,599 units), and validation (39,735) sets while ensuring that all three were distinct w.r.t. subarea coverage.
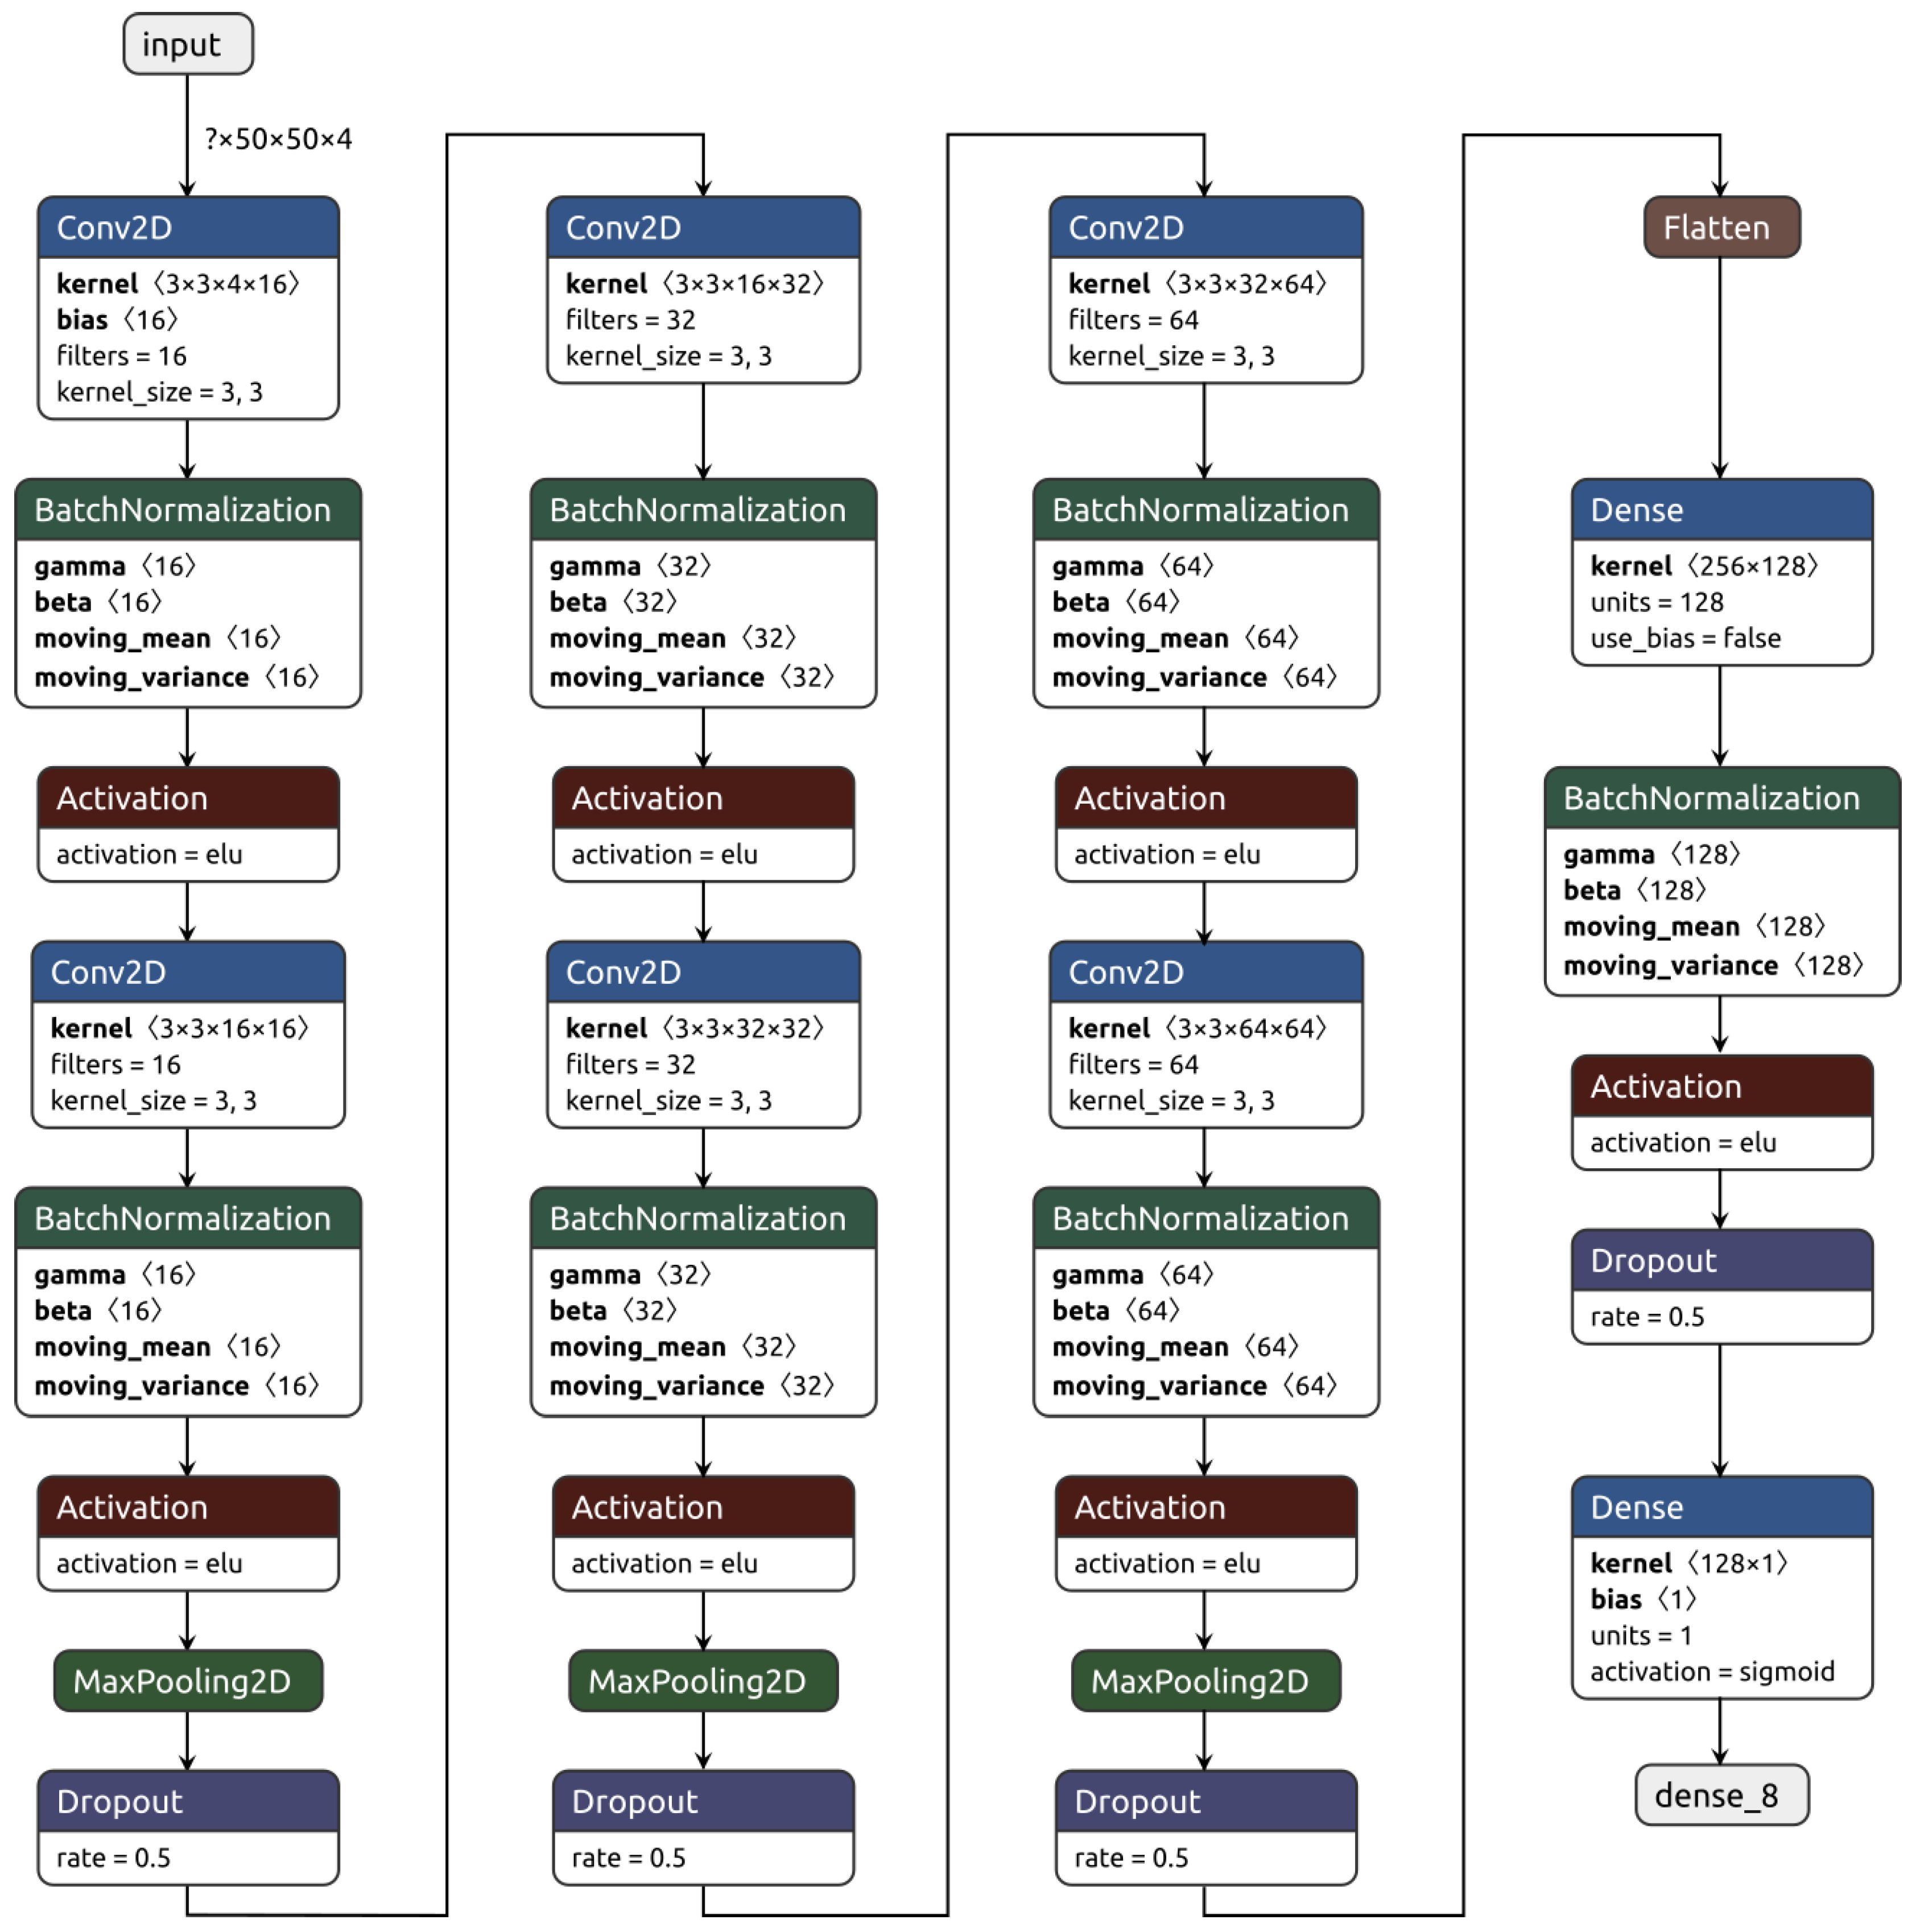
The chosen land abandonment binary classifier architecture is a convolutional neural network (CNN). The model was implemented using the Keras library, backed by TensorFlow. As is typical for a CNN, the base architectural unit is a sequence of convolutional, batch normalization, activation, pooling, and dropout layers with progressively decreasing throughput dimensionality (Figure 6). Hyperparameter tuning for the outlined layers was performed automatically via a grid search. Because of the class imbalance of abandoned lands compared with the null class, the output data were assigned weights according to the following formula:
where is the number of samples, is the number of classes, and is a vector containing the occurrences of each class. The result was 0.852 for class 0 and 1.21 for class 1. The trained model attained 0.855 auc (area under curve), 0.47 loss, and 0.78 accuracy under testing. The confusion matrix Table 1 results indicate that the model achieved 0.659 precision and 0.777 recall, and therefore, its -score was 0.713. The model representation was subsequently persisted in an h5 file for the purpose of later prediction.
The prediction data were collected using Sentinel Hub data from August of 2018, with a 1:1 correspondence between imagery and data (i.e., a single photograph was selected for a given element). Image identifiers were collected in the form of a CSV file and can be found in the manuscript Supplementary data. Any discrepancies were corrected via resampling. The preprocessing of prediction data was conducted in an identical way to that performed during the training process. To be exact, the entirety of the Łódź Voivodeship was overlaid with a square grid. Image capture was conducted by maximizing the coverage area, i.e., even grid elements that were only partially within the voivodeship were taken into account. The final classification input dataset comprised 69,945 grid elements with a total area of 17,486.25 km2, enclosing 96% of the voivodeship. Every element was classified through the generated model using a sigmoid activation function and, as mentioned previously, nominalization to land abandonment/no land abandonment according to the 0.5 activation threshold.
During fieldwork validation, our results were confronted with on-the-ground August 2018 surveys, covering 20 research areas of 16 km2 each. Result maps were prepared using the QGIS suite, and auxiliary graphs and diagrams were generated with the help of matplotlib and seaborn Python libraries. Subsequently, a surface analysis of value distribution vis-à-vis per-element activation function values was conducted. The Getis–Ord Gi* was used, which is a cluster detection technique distinguishing hot- and coldspots with respect to the activation function, corresponding to the appropriate land abandonment occurrence probability. ArcGis was used to prepare hotspot maps.
3. Results
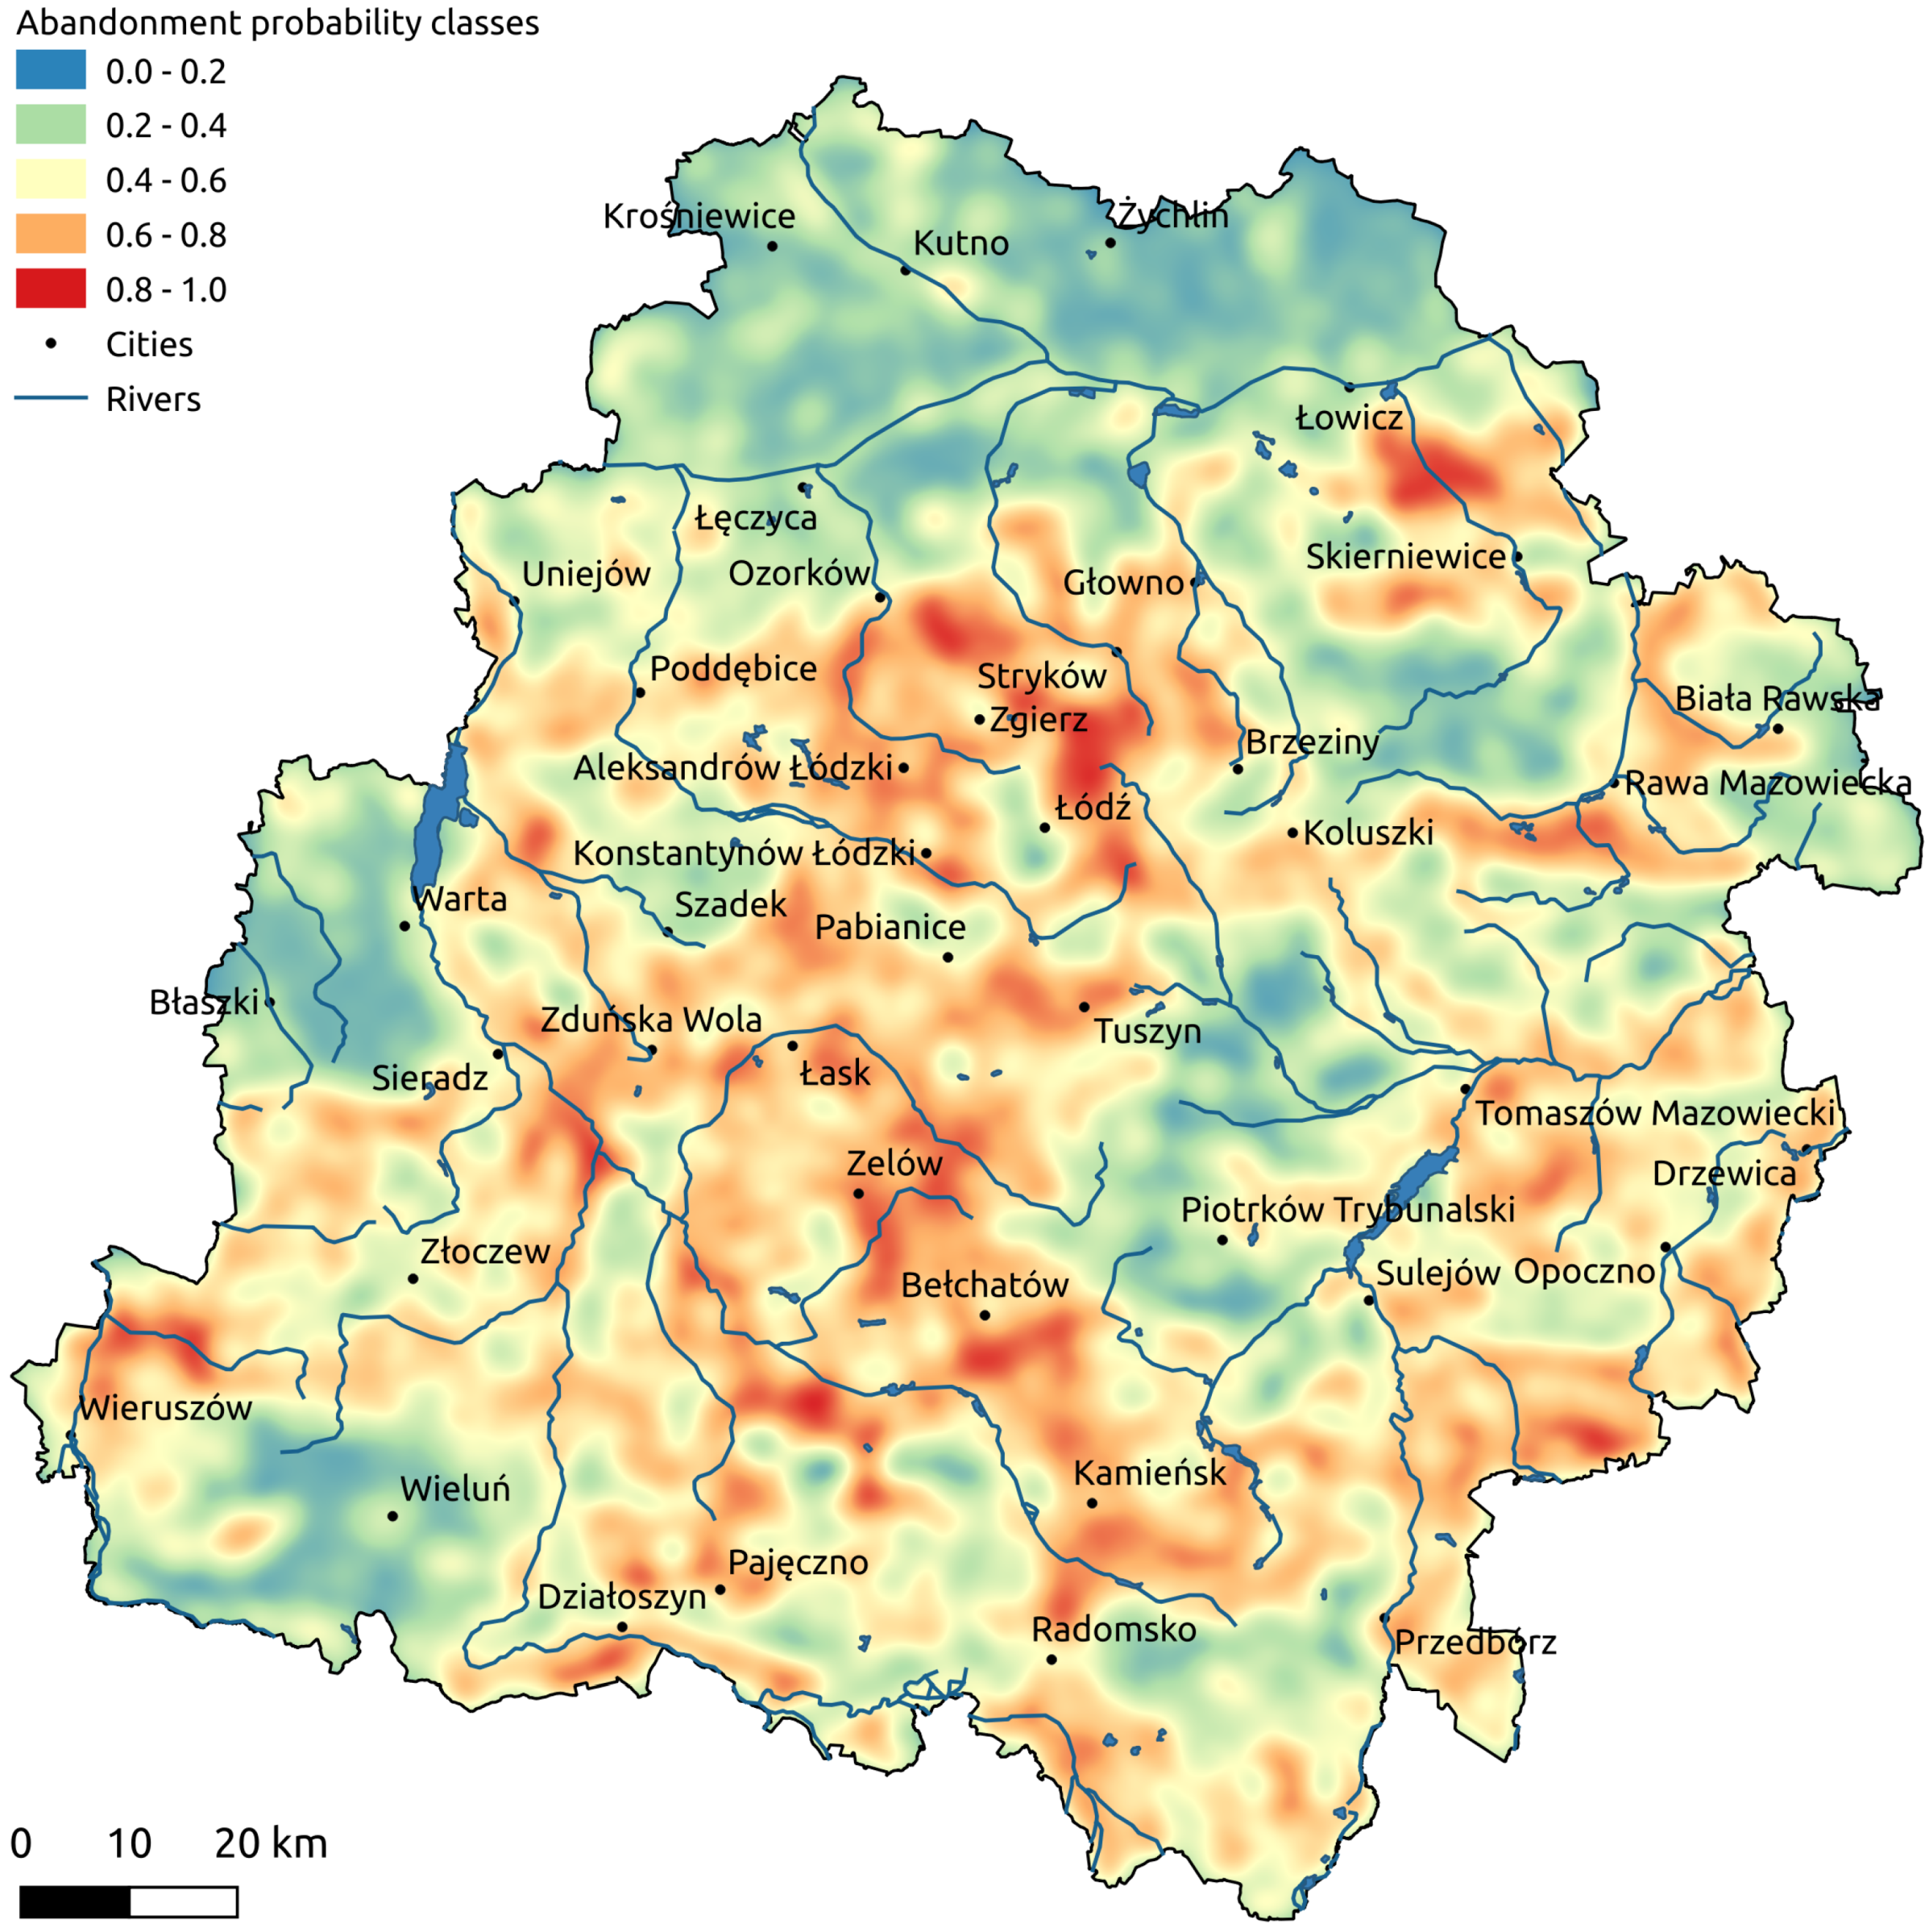
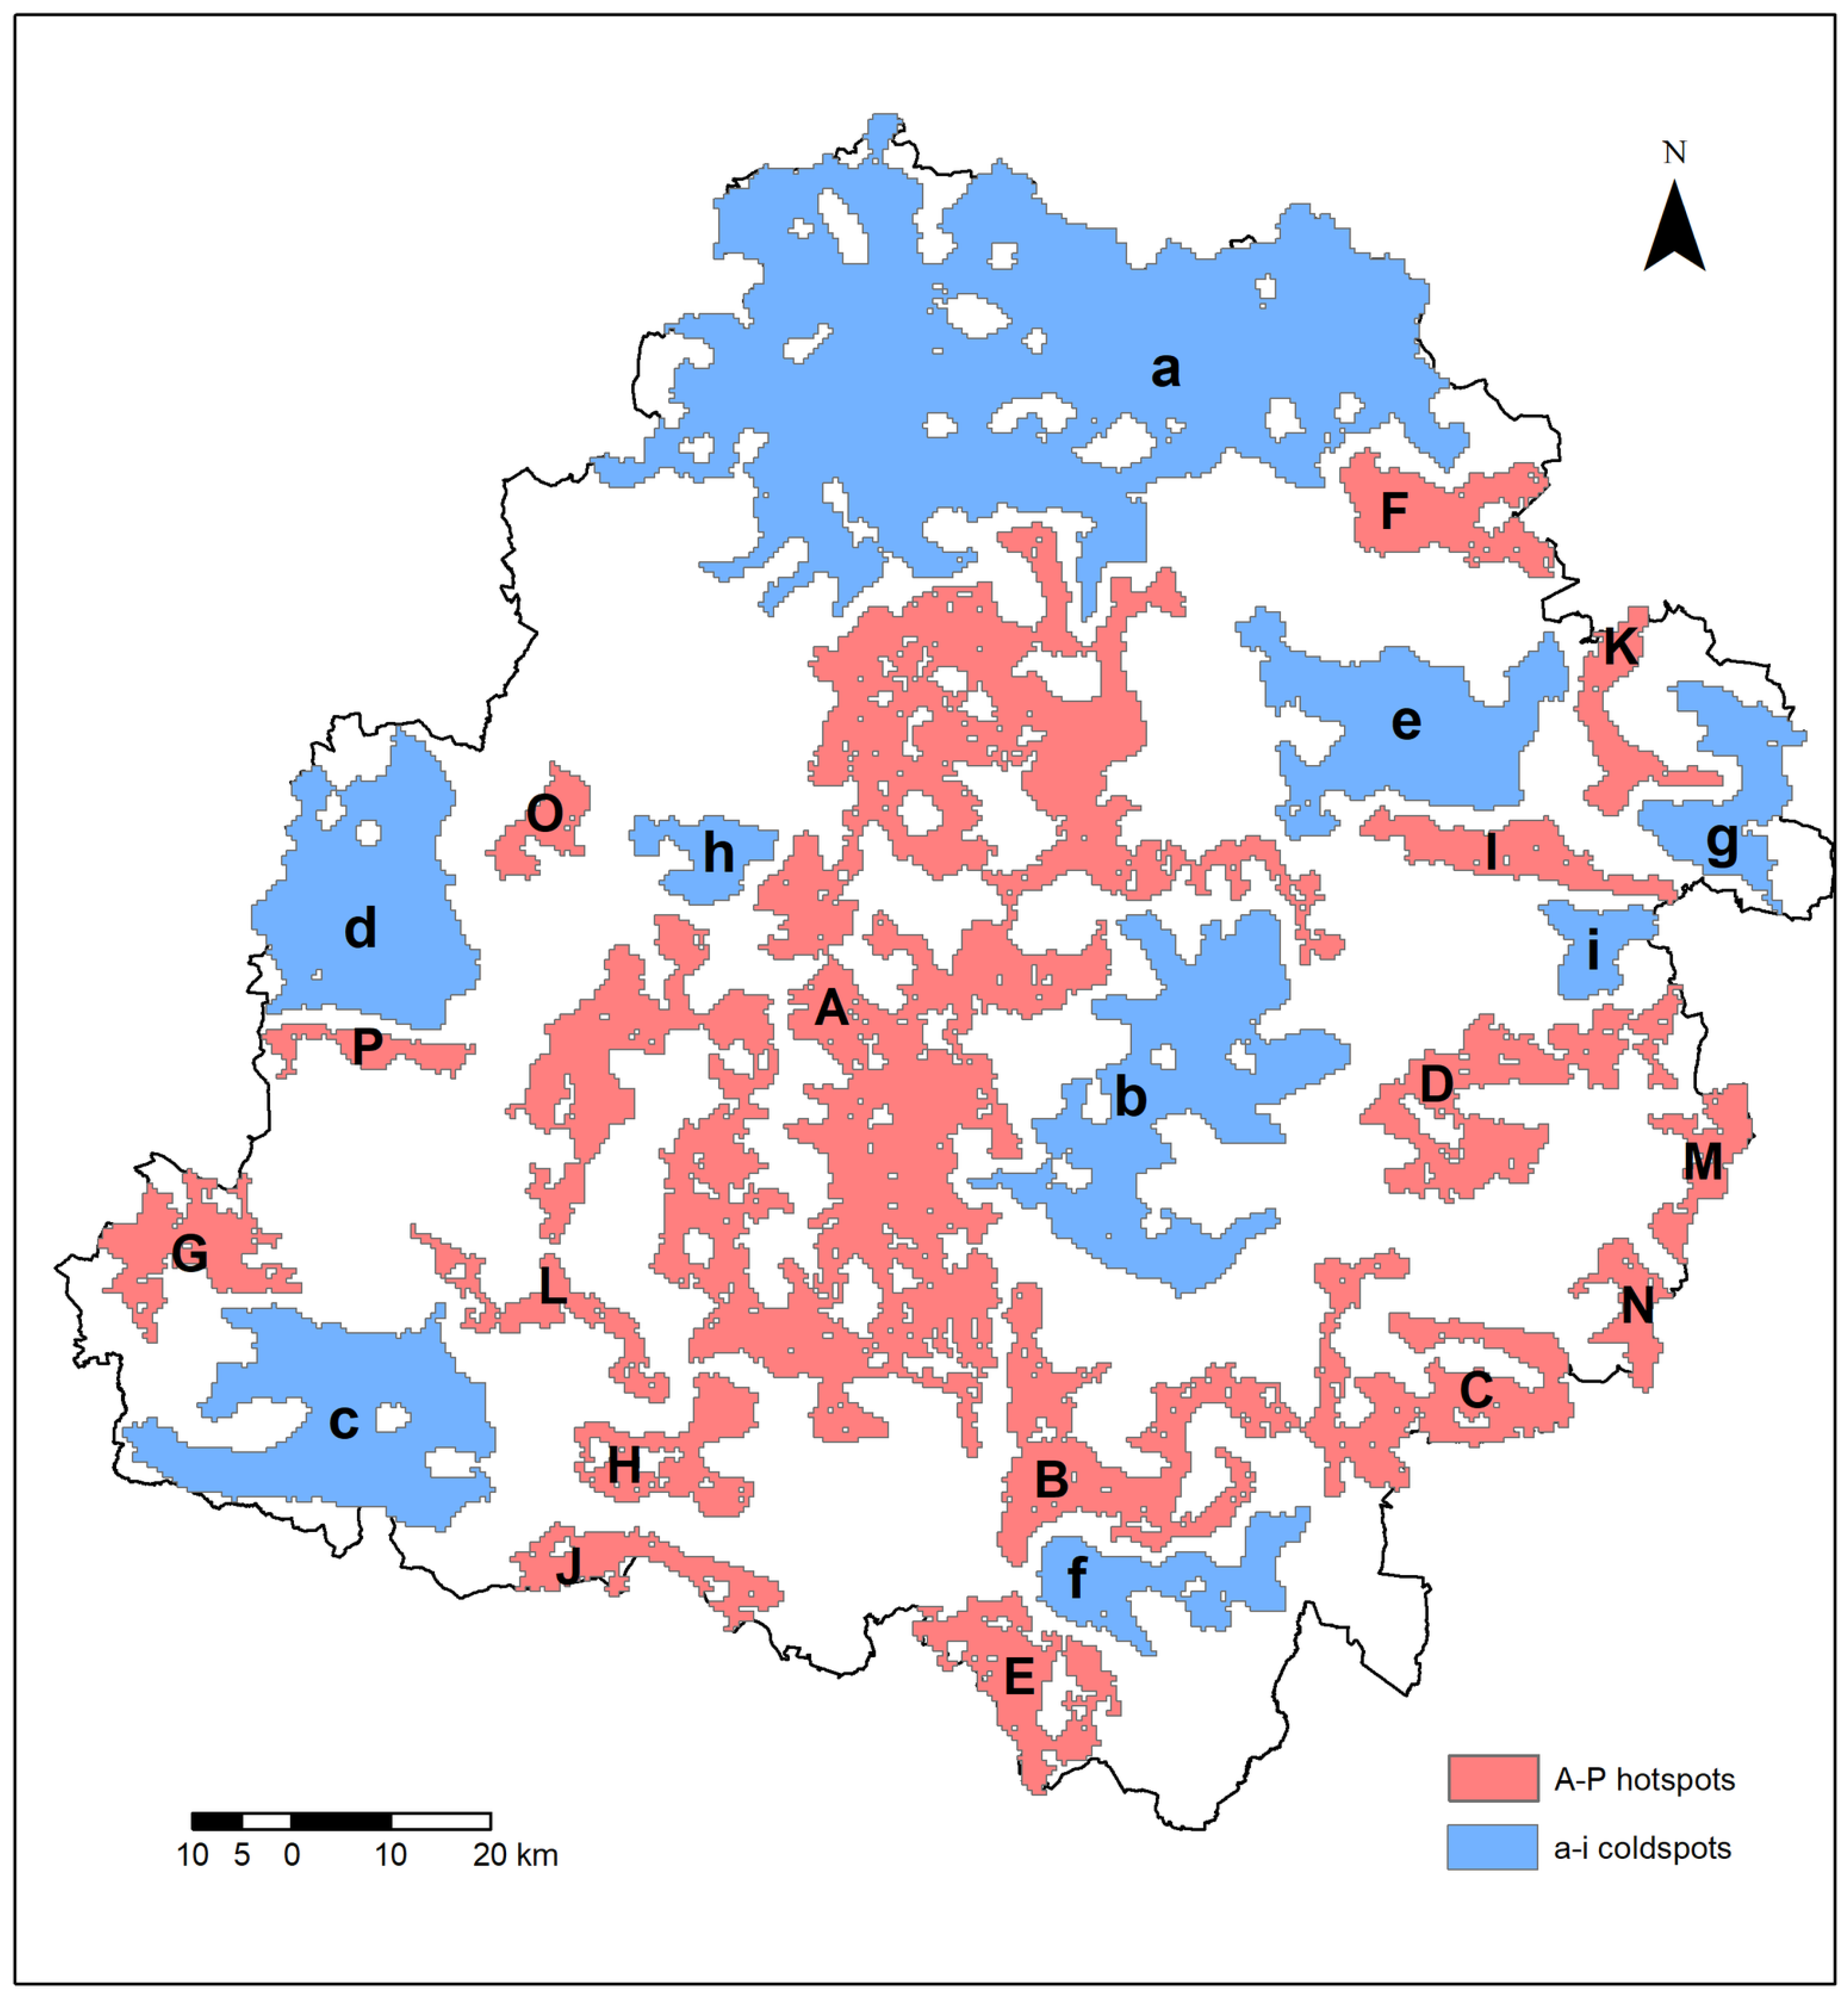
The primary artifact of the described research approach is a probability distribution map of land abandonment across the Łódź Voivodeship as of 2018, represented as a heatmap (Figure 7). The final heatmap is the result of further postprocessing, specifically thresholding, in order to solely render cold- and hotspots (Figure 8), displaying clusters of low and high probability of land abandonment according to the Getis–Ord Gi* statistic. The end result is characterized by contiguous areas of low and high probability, with a significance level of 99%. Further filtering was applied to only include contiguous, unconnected areas, with individual surfaces greater than 50 km2. Areas with the highest probability of land abandonment, shown on the map in red, comprise 16 sprawling hotspots (Figure 8, Table 2). The total surface of all hotspots in the Łódź Voivodeship is 4771.5 km2. Areas with the lowest probability of land abandonment, colored blue, comprise 9 coldspots displaying comparatively more compact shapes (Figure 8, Table 3). Coldspots are, overall, the most dominant feature, with a total surface area of 5011 km2, 27.5% of the voivodeship.
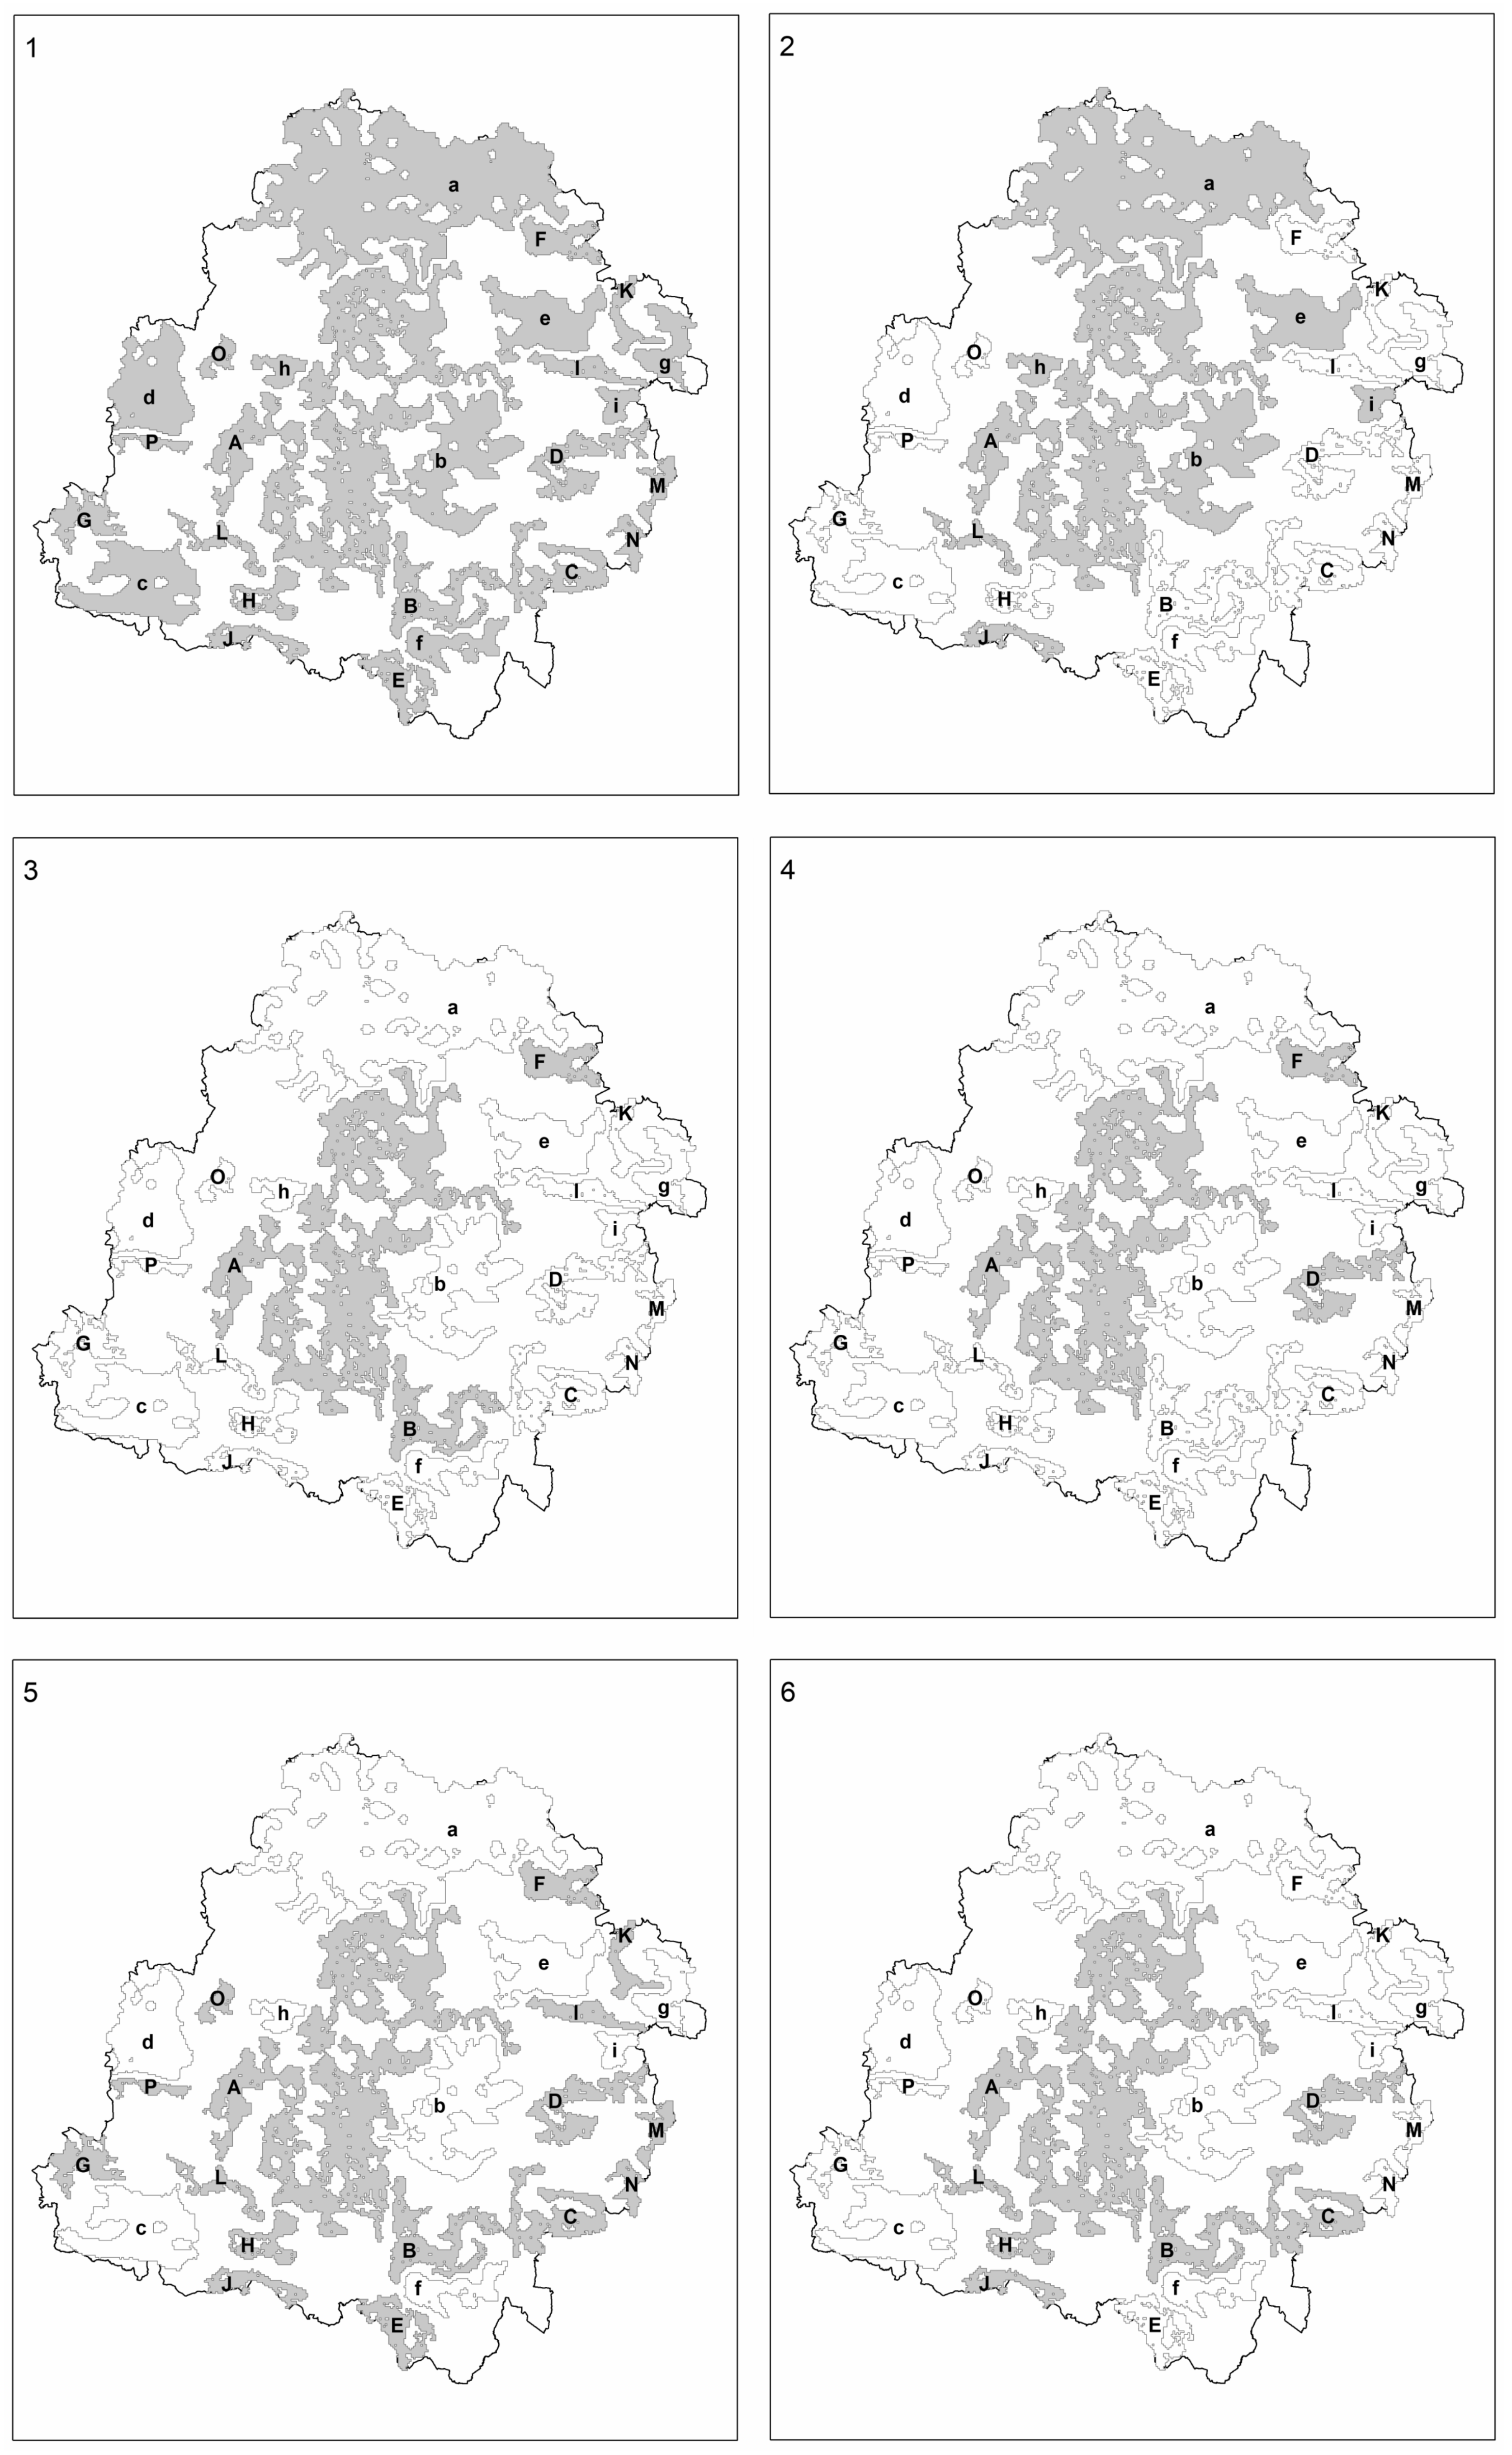
To the best of our knowledge, our study comprises the first comprehensive land abandonment probability distribution analysis for the entirety of the 18,218.95 km2 area of the Łódź Voivodeship. Earlier attempts by a subset of the authors [55] were performed in the context of significantly smaller regions, thus limiting the discoverability of more universal trends influencing this phenomenon for both cold- and hotspots of the relevant probability distribution. Among the most critical factors for the occurrence of land abandonment coldspots are (Figure 9):
- The presence of soil complexes assigned to the highest classes of arability (1,2,3,4,8) [52], applicable to all coldspots, i.e., (a–i);
- The presence of soils with a high proportion of silt, a characteristic that affects their air-and-moisture-related properties, improves vegetation access to groundwater, and simultaneously retards rain-and meltwater infiltration. This feature is dominant in the following coldspots: (b), (c), (d), (e), (f), (g), and (i);
- The presence of soils developed from till or clayey sand underlain by till. This occurs in all coldspots other than (f);
- The presence of a relatively homogeneous landscape, dominated by plains and thus beneficial to agriculture. Coldspot (a) provides the starkest example with level terrain and a dominant, slightly southern slope, facilitating drainage of excessive melt- and rainwater towards the Bzura river valley. Plains also characterize the following coldspots: (b), (e), (h), and (i).
The following natural, socioeconomic, and/or locational factors that contribute to the presence of hotspots were found:
- Low-quality soil, usually of those qualified as (6), (7), (9) among arability complexes, as well as (very) poor meadowland and pastures “3z” [52]. The aforementioned complexes are common within all identified hotspots;
- A significant presence of forest complexes, especially in the form of numerous sparse patches. A characteristic of abandoned land distribution is a higher occurrence on the peripheries of cultivated fields neighboring forests. This property is intrinsic to all identified hotspots;
- The vicinity of expressways, motorways, and the associated interchanges. Present in hotspots (A), (B), and (F);
- The presence of urbanization and suburbanization near major cities, e.g., Łódź and Zgierz for hotspot (A), as well as in hotspots (D) and (F);
- The vicinity of sand, gravel, sandstone, and limestone extraction sites, as well as the presence of poor-quality soils bordering lignite strip mines. This exploitation of natural resources influences the scale of land abandonment in hotspots (A), (B), (C), (D), (H), (J), and (L);
- The presence of forests and zones along riversides and around the shorelines of lakes and reservoirs, where natural assets have contributed to the development of vacation settlements. Recreational land use among abandoned lands is characteristic of hotspots (A), (B), (C), (D), (L), (O);
- Undulating terrain, with an increased occurrence of hills to the point of hindering fieldwork and facilitating excessive drainage. This relationship arises in hotspots located in the southern portion of the Łódź Voivodeship, such as (L) and (J), and in the relevant part of the (A) hotspot;
- Overgrowth of disused meadows and pastures located in river valleys. Present in all relevant areas but especially prominent in the following hotspots: (A), (B), (C), (D), (E), (J);
- Frontier and periphery locations combined with low economic feasibility, apparent within the southeastern and southern borderlands of the voivodeship. These conditions are relevant to the following hotspots: (C), (E), (J), (M), (N).
4. Discussion
The resultant 2018 land abandonment probability distribution map of the Łódź voivodeship (Figure 7) displays a marked correspondence to 1996 and 2002 abandonment and fallow communal land maps of Poland, prepared using then-available statistical data [4,5]. Many communes (lowest administrative subdivisions) in the southeastern portion of the voivodeship are 20–40% abandoned lands, with this amount even exceeded locally. In the aforementioned historical reports, areas of considerable abandonment were also ones of so-called “cultivative problem zones”. The latter encompassed areas of the lowest agricultural utilization country-wide, unfavorable environmental conditions, and/or conflicting nonagricultural uses [56]. In fact, the indicated portions of the voivodeship were also within the peripheries of two cultivative problem zones: the Świętokrzyskie region and the Polish Jurassic Highland. The current distribution of abandoned lands (Figure 7) confirms the multiannual continuity of the abandonment process, as well as a potential for advanced, secondary plant succession in some regions. As witnessed through on-the-ground observations across the Łódź voivodeship, the contemporary degree of tree canopy cohesion over abandoned lands resembles juvenile-stage forestation.
In order to evaluate the veracity of the land abandonment probability distribution map in the Łódź Voivodeship (Figure 7), a comparative study was performed to assess the ground-level presentation of land coverage. Two representative research areas were chosen, each of 16 km2, named “Cieszanowice” and “Dmenin”. Both units are located outside of the landscape parks utilized to compose datasets for the machine learning models.
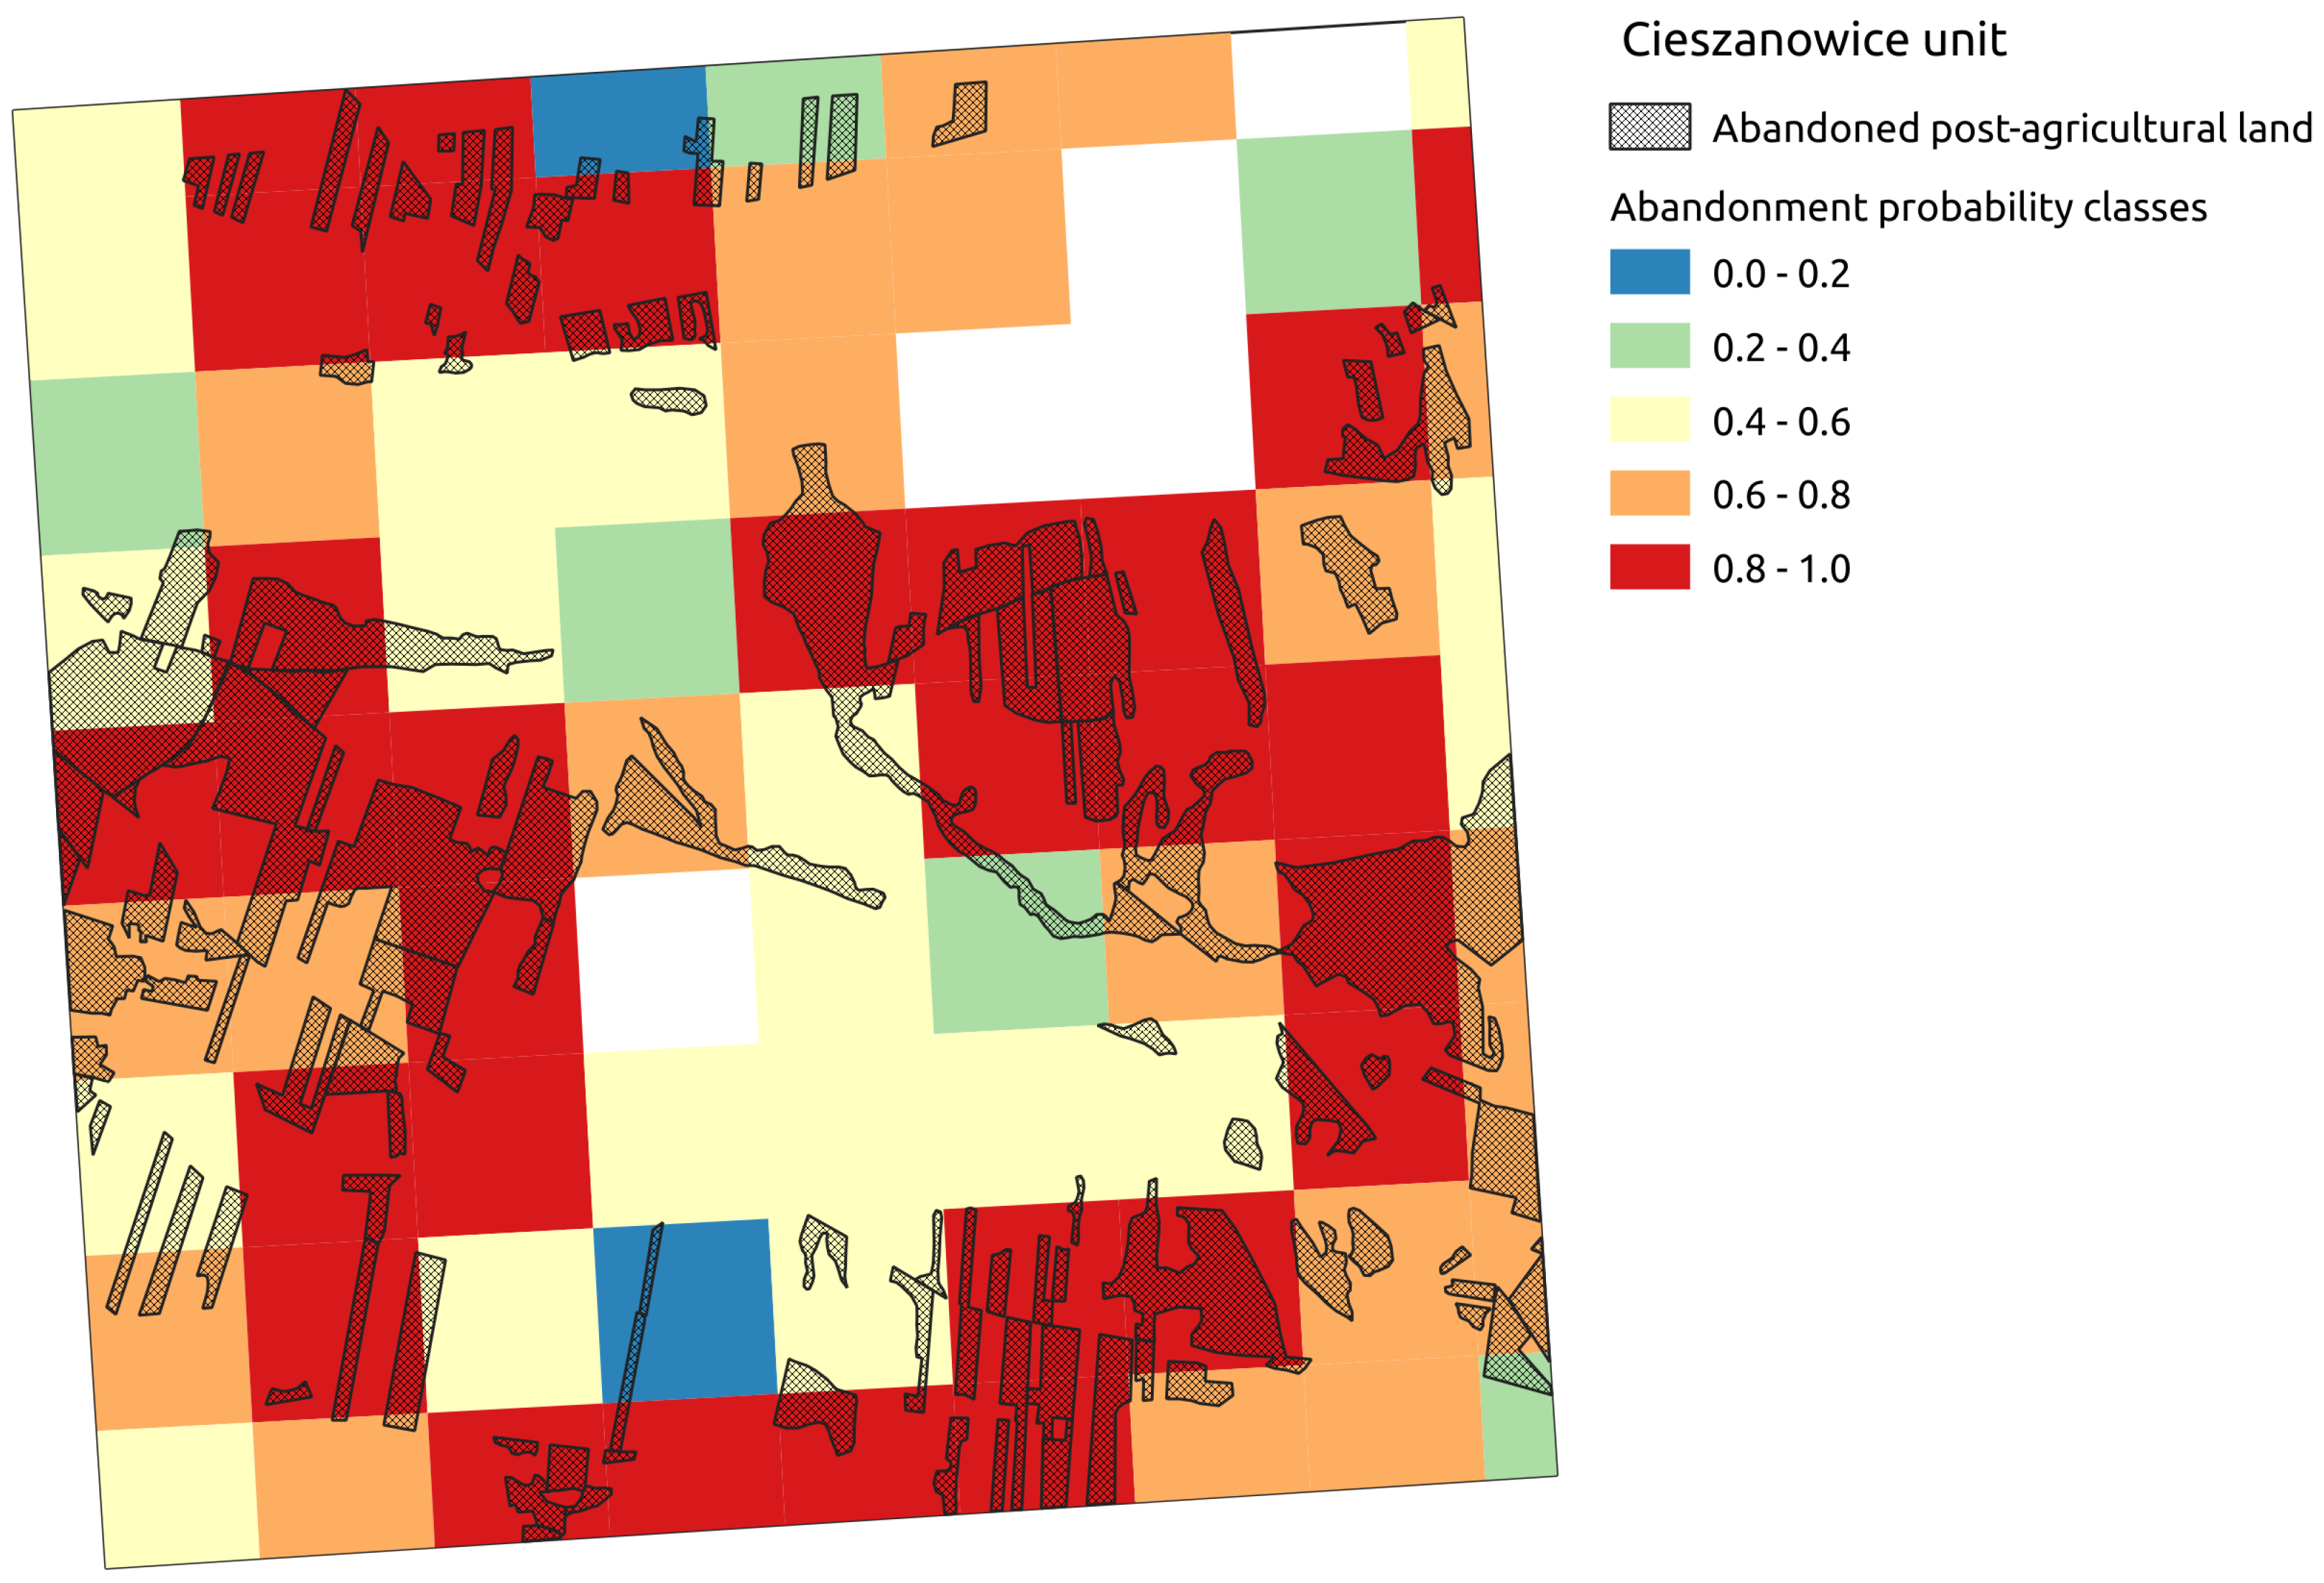
The “Cieszanowice” unit, encompassing the Cieszanowickie Lake and its vicinity, represents a high-land-abandonment area because it is found within the Kamieńsk hotspot (B). At the end of the spectrum, the “Dmenin” unit has been subject to intensive agricultural cultivation and is within the Przedbórz-Radom coldspot (f). The “Cieszanowice” unit, surveyed for land abandonment on 2018-07-25, represents areas with low biotic productivity. The area contains overly permeable glacial and fluvioglacial sands and gravels, eolian sands, as well as fluvial sands and gravels [57]. As evidenced through research on the physical and chemical soil properties of similar areas [18,21,22,58,59,60,61,62,63,64], these characteristics often render agricultural activity economically unviable and therefore lead to land abandonment. In the specific case of the “Cieszanowice” unit, the land abandonment process was augmented by the creation of a reservoir, as well as the recreational land usage associated with such a development [65]. The corresponding fragment of the probability distribution map is therefore verified (Figure 10).
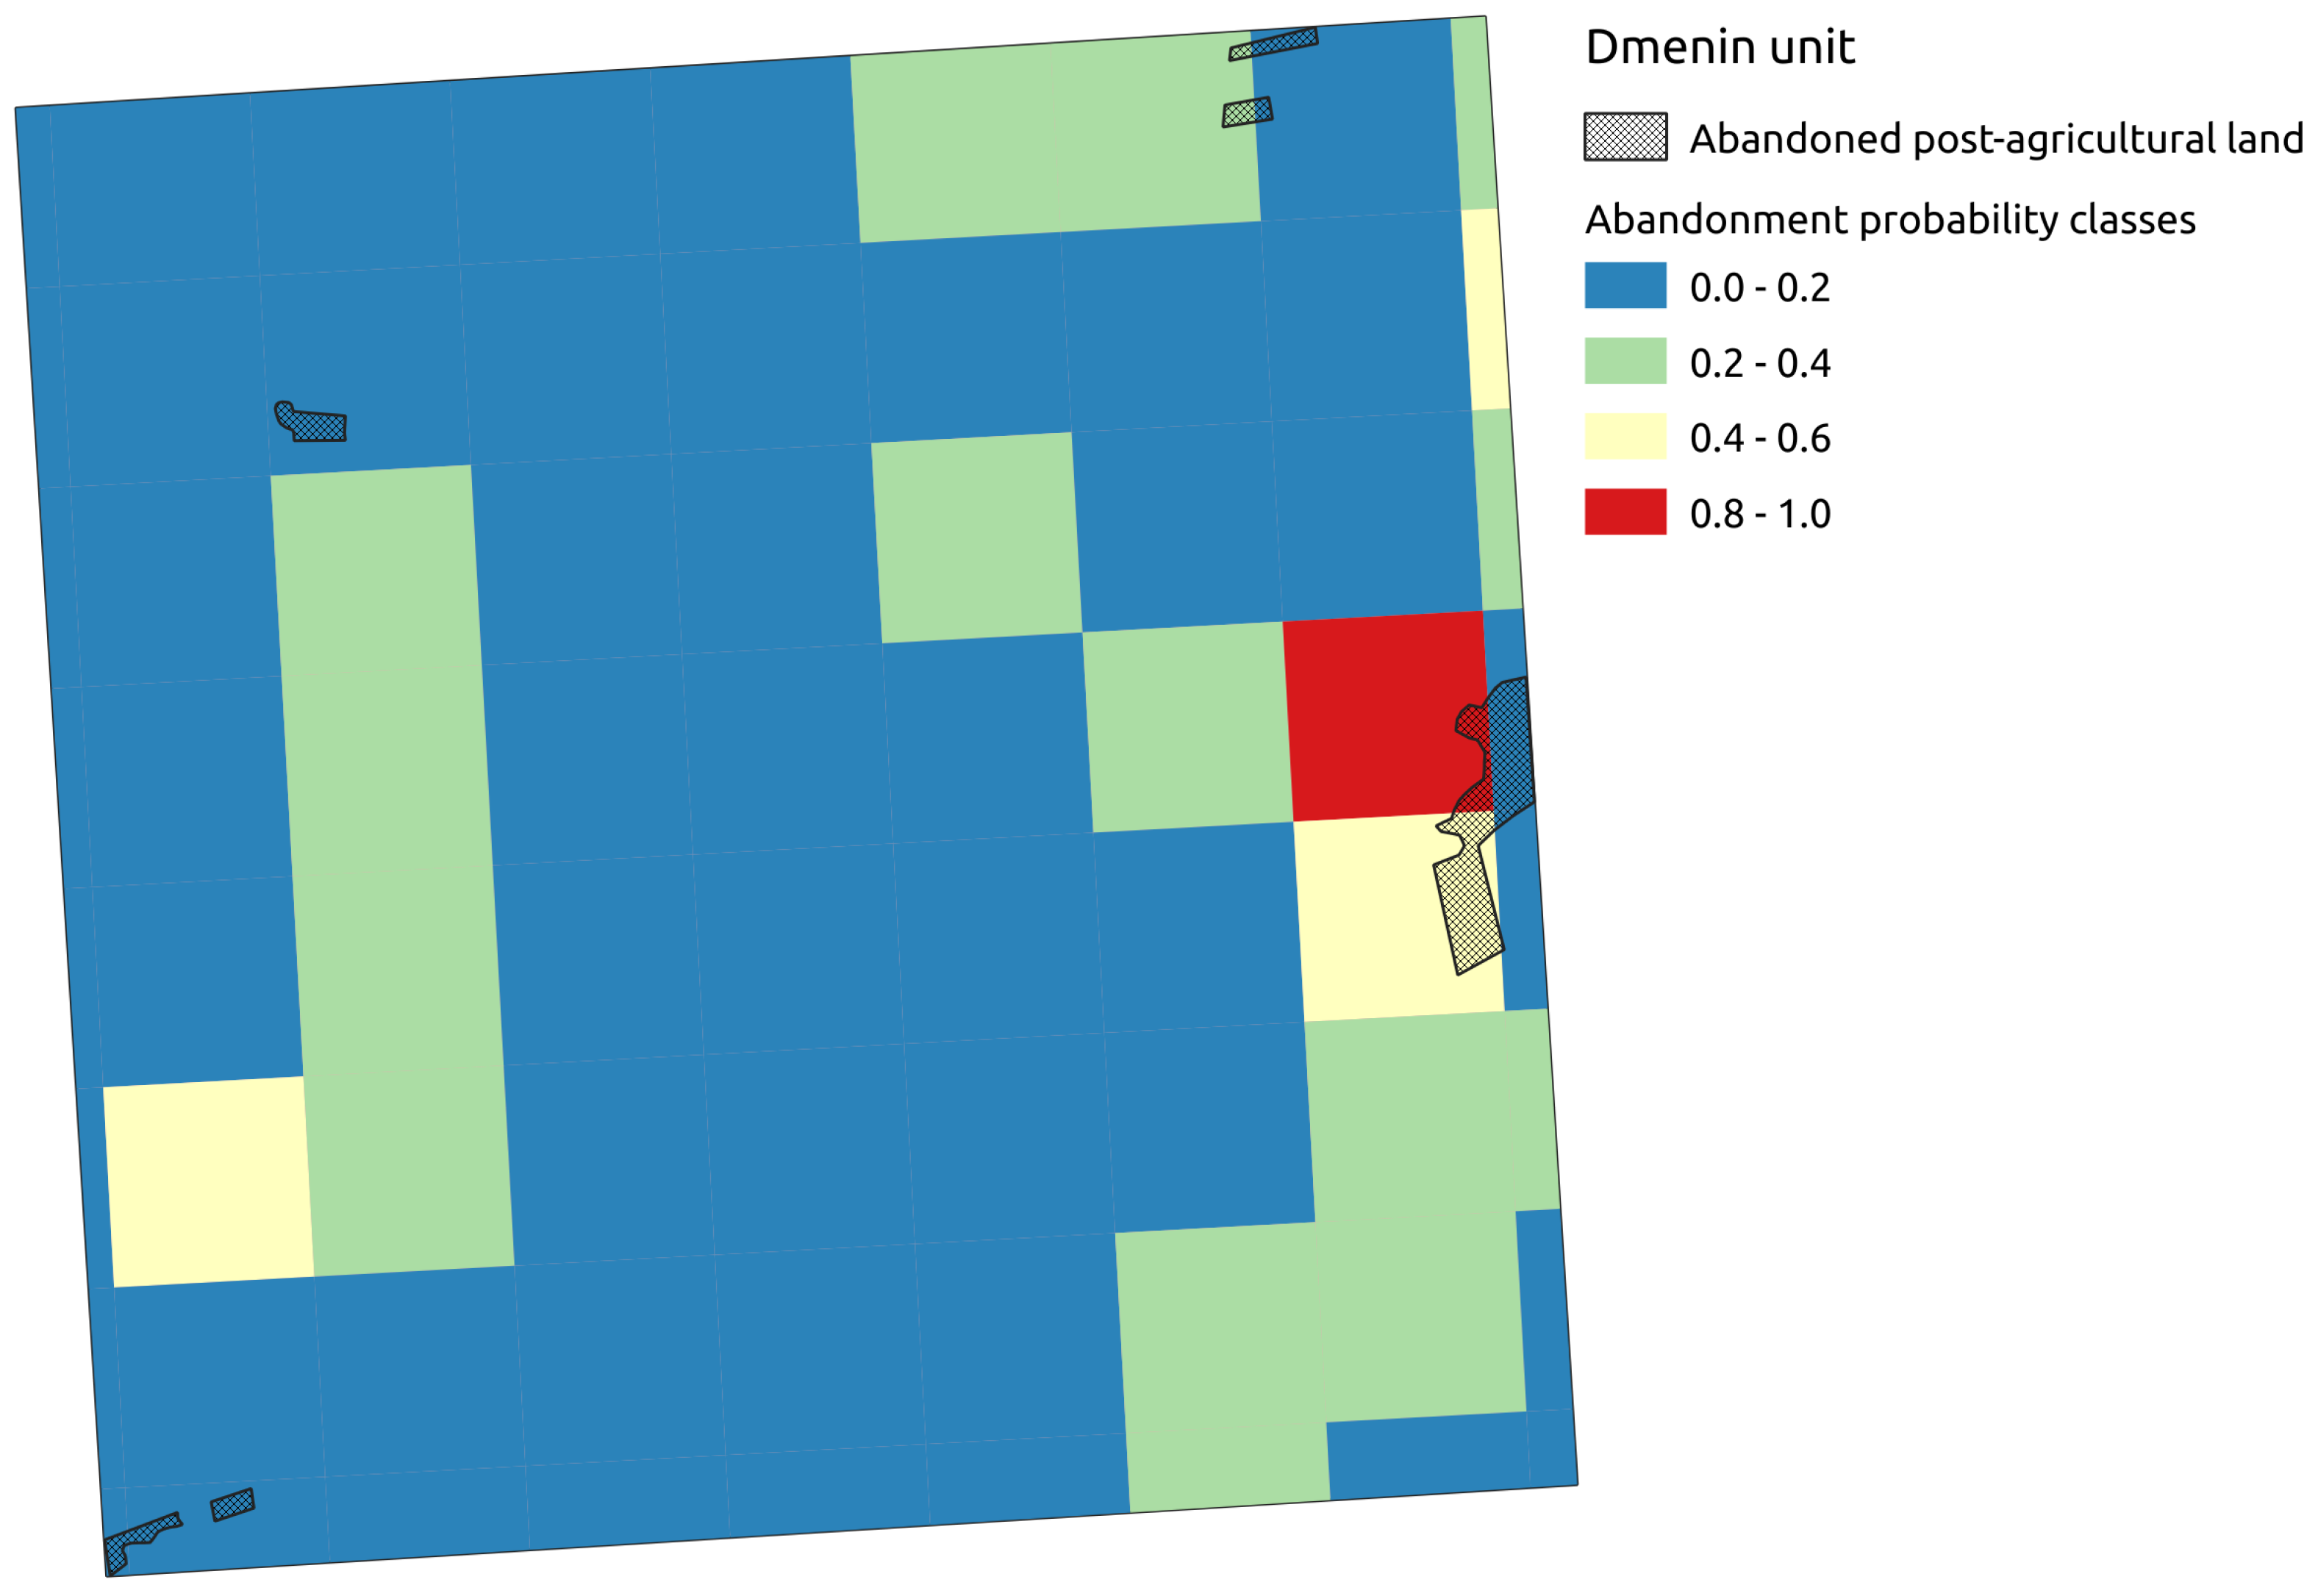
The “Dmenin” unit, surveyed for land abandonment on 2018-07-02, represents a highly cultivated area. Present here are concentrations of tills, glacial and fluvioglacial sands, and gravels, as well as outcrops of Cretaceous sands and Jurassic limestones [66]. In addition, there is a series of aeolian, periglacial dusts, with a thickness of up to 1 m, a deciding factor of high arability. The silts cover virtually the entire surface of the unit, contributing to beneficial air-and-moisture-related properties, regardless of whether they coat tills or overly permeable sands and gravels. Another component advancing the favorable quality of the agricultural production space is the generation of a rich sorption complex [58,59,67]. The appropriate portion of the probability distribution map aligns with the above observations (Figure 11).
5. Conclusions and Future Work Opportunities
As evidenced by the performed comparative studies, automatic land abandonment detection based on the application of modern Convolutional Neural Networks via satellite imagery is indeed viable. The principal benefits of our proposed approach are both time-efficiency and cost-effectiveness. We were able to classify, designating land abandonment hotspots, an area in excess of 18,000 km2 at a fraction of the cost and time that a human-run orthophoto analysis would consume. Complementary to the aforementioned advantage, 5011 km2 of the studied area was located in coldspots. This provides an ancillary benefit to the possibility of deprioritizing verification fieldwork where it is possibly less pressing. A potential positive side effect of our proposed method is reduced human involvement in the classification process. Such increased independence might diminish deleterious factors such as confirmation bias or possible result tampering. Lastly, result-wise, the extraction of cold- and hotspots allowed for a high-level analysis of the environmental conditions accompanying sparse and intense land abandonment in the Łódź Voivodeship. This generates the potential for both further theoretical study and the refinement of future machine learning models.
Indeed, there are several possible areas of improvement in our approach to perfecting the current model. Preprocessing could be improved by using a separate CNN [49] or leveraging a specialized architecture, such as a Generative Adversarial Network (GAN) [68]. Compensating for any missing data in this way will possibly allow for greater model fidelity. An important subproblem of classifying abandoned lands is the evolution of vegetation as a given plot is overtaken by successive stages of overgrowth. This corresponds to the various grades of land abandonment denoted in the Methods and Materials section. Furthermore, solutions could be derived from the related study of deforestation analysis, such as that in [69]. As noted in the literature section, adding temporal information either implicitly through multiple images of the same area [43] or explicitly via encoding in the model structure [44] could also improve classification results. However, in our particular case, this could provide limited utility, as source-of-truth surveys are performed at specific times of the year, reducing the maximum possible temporal resolution of the classification.
Finally, transfer learning, i.e., training new models for different data on the basis of existing ones, could prove advantageous when classifying additional areas. In fact, this has already been verified as effective in at least one scenario for land cover classification [42].
Supplementary Materials
The following materials are available online at https://github.com/softwaremill/land-abandonment-detection/tree/v1: date timestamps for Sentinel Hub data (under “data”), data ingestion and prediction scripts (under “notebooks”), and trained Convolutional Neural Network architecture model (under “models”).
Author Contributions
Conceptualization, S.K., A.M., E.P.; methodology, S.K., A.M. and M.A.; software, M.A.; validation, S.K., A.M. and E.P.; formal analysis, M.A. and A.M.; investigation, S.K. and M.K.; resources, M.A. and M.K.; data curation, M.A.; writing–original draft preparation, S.K., A.M., E.P., M.K. and M.A.; writing–review and editing, M.K. and Majchrowska A.; visualization, M.A. and A.M.; supervision, S.K. and E.P.; project administration, M.A. All authors have read and agreed to the published version of the manuscript.
Funding
This research received no external funding.
Acknowledgments
We would like to thank Małgorzata Orzechowska for an additional linguistic review as well as Tomasz Napierała, for the helpful remarks.
Conflicts of Interest
The authors declare no conflict of interest. The funders had no role in the design of the study; in the collection, analyses, or interpretation of data; in the writing of the manuscript, or in the decision to publish the results.
References
- Borowska-Stefańska, M.; Leśniewska-Napierała, K.; Wiśniewski, S. Land cover changes in Poland between 1990 and 2012. Geografie 2018, 123, 63–89. [Google Scholar] [CrossRef] [Green Version]
- Janus, J.; Bożek, P. Land abandonment in Poland after the collapse of socialism: Over a quarter of a century of increasing tree cover on agricultural land. Ecol. Eng. 2019, 138, 106–117. [Google Scholar] [CrossRef]
- Krysiak, S. Współczesne tendencje zmian w użytkowaniu nadpilicznych krajobrazów rolniczych na tle potencjału siedliskowego geokompleksów. Probl. Ekol. Kraj. 2006, XV, 228–241. [Google Scholar]
- Bański, J. Gospodarka Ziemią w Polsce w Okresie Restrukturyzacji; IGiPZ PAN: Warszawa, Poland, 1998; pp. 1–117. [Google Scholar]
- Bański, J. Geografia Polskiej Wsi; PWE: Warszawa, Poland, 2006; pp. 1–218. [Google Scholar]
- Kucharski, L. Przemiany roślinności łąkowej w Polsce Środkowej w wyniku zmian metod gospodarowania. In Problemy Ochrony I UżYtkowania ObszaróW Wiejskich O DużYch Walorach Przyrodniczych; Wydawnictwa Uniwersytetu Marii Skłodowskiej-Curie: Lublin, Poland, 2000; pp. 227–234. [Google Scholar]
- Orłowski, G.; Nowak, L. Problematyka odłogowania gruntów w świetle wyników badań prowadzonych w krajach Europy Zachodniej i Stanach Zjednoczonych. (Artykuł przeglądowy). Acta Sci. Pol. Agric. 2004, 3, 27–36. [Google Scholar]
- Statistics Poland. Land use. In Rural Areas in Poland—National Agricultural Census 2010; Statistics Poland: Warszawa, Poland, 2013; pp. 1–87. [Google Scholar]
- Rozporządzenie Ministra Rozwoju Regionalnego i Budownictwa z dnia 29 Marca 2001 r. w Sprawie Ewidencji Gruntów i Budynków (Dz. U. rok 2001, nr 38, poz. 454); Chancellery of the Prime Minister of Poland: Warsaw, Poland, 2001.
- Krysiak, S. Odłogi w krajobrazach Polski środkowej-aspekty przestrzenne, typologiczne i ekologiczne. Probl. Ekol. Kraj. 2011, XXXI, 89–96. [Google Scholar]
- Czesak, B.; Cegielska, K.; Cherkes, B.; Różycka-Czas, R.; Salata, T. Fieldwork approach to determining the extent of agricultural land abandonment—Case study. Geomat. Landmanag. Landsc. 2016, 3, 21–31. [Google Scholar] [CrossRef]
- Krysiak, S. Struktura użytkowania ziemi w dorzeczu Dzierżąznej–charakterystyka i aspekty hydrologiczne zagospodarowania zlewni. Folia Geogr. Phys. 2000, 5, 83–92. [Google Scholar]
- Matuszyńska, J. Zmiany użytkowania terenu jako element transformacji środowiska przyrodniczego na obszarze wybranych zlewni Poznania i jego strefy podmiejskiej. In Prace Komisji Geograficzno-Geologicznej; PTPN: Poznań, Poland, 2001; Volume 30, pp. 1–160. [Google Scholar]
- Krysiak, S. Contemporary land-use changes in Central Poland. Pap. Glob. Chang. IGBP 2008, 15, 89–103. [Google Scholar]
- Krysiak, S. Ekologiczne aspekty przemian użytkowania ziemi w wybranych typach krajobrazów naturalnych Polski Środkowej. Probl. Ekol. Kraj. 2008, XXI, 299–310. [Google Scholar]
- Krysiak, S. Ekologiczno-krajobrazowy wymiar odłogowanych gruntów porolnych—przykłady z województwa łódzkiego. In Obszary Metropolitalne We Współczesnym środowisku Geograficznym; Oddział Łódzki PTG-Wydział Nauk Geograficznych Uniwersytetu Łódzkiego: Łódź, Poland, 2010; pp. 309–320. [Google Scholar]
- Jermaczek, D. Analiza rozmieszczenia i struktury zadrzewien powstalych na odlogowanych gruntach porolnych w okolicach Lagowa w latach 1990–2007. PrzegląD Przyr. 2007, XVIII, 29–53. [Google Scholar]
- Krysiak, S.; Papińska, E.; Majchrowska, A. Abandoned agricultural lands in buffer zones around landscape parks in the Łódź Voivodeship—habitat background, spatial distribution, scale of the phenomenon. In The Ecological Role of Abandoned Agricultural Lands in Buffer Zones Around Landscape Parks in the Łódź Voivodeship; Krysiak, S., Adamczyk, J., Eds.; Wydawnictwo Uniwersytetu Łódzkiego: Łódź, Poland, 2016. [Google Scholar] [CrossRef]
- Majchrowska, A. Abandonment of agricultural land in central Poland and its ecological role. Ekológia 2013, 32, 320–327. [Google Scholar] [CrossRef]
- Majchrowska, A. Odłogowanie gruntów w otoczeniu parków krajobrazowych. In Studia Obszarów Wiejskich; IGiPZ PAN: Warszawa, Poland, 2014; Volume XXXV, pp. 215–226. [Google Scholar]
- Papińska, E. Abandoned lands around the Sieradz landscape parks (Załęcze Landscape Park, Warta–Widawka Interfluve Landscape Park). In The Ecological Role of Abandoned Agricultural Lands in Buffer Zones Around Landscape Parks in the Łódź Voivodeship; Krysiak, S., Adamczyk, J., Eds.; Wydawnictwo Uniwersytetu Łódzkiego: Łódź, Poland, 2016; pp. 22–29. [Google Scholar]
- Papińska, E. Siedliska terenów odłogowanych w otoczeniu Załęczańskiego Parku Krajobrazowego. Probl. Ekol. Kraj. 2016, XLI, 147–159. [Google Scholar]
- Szostak, M.; Hawryło, P.; Piela, D. Using of Sentinel-2 images for automation of the forest succession detection. Eur. J. Remote Sens. 2018, 51, 142–149. [Google Scholar] [CrossRef]
- Kołecka, N.; Kozak, J.; Kaim, D.; Dobosz, M.; Ginzler, C.; Psomas, A. Mapping Secondary Forest Succession on Abandoned Agricultural Land with LiDAR Point Clouds and Terrestrial Photography. Remote Sens. 2015, 7, 8300–8322. [Google Scholar] [CrossRef] [Green Version]
- Janus, J.; Bożek, P. Using ALS data to estimate afforestation and secondary forest succession on agricultural areas: An approach to improve the understanding of land abandonment causes. Appl. Geogr. 2018, 97, 128–141. [Google Scholar] [CrossRef]
- Kołecka, N.; Kozak, J. Wall-to-wall parcel-level mapping of agricultural land abandonment in the Polish Carpathians. Land 2019, 8, 129. [Google Scholar] [CrossRef] [Green Version]
- Faliński, J.B. Interpretacja współczesnych przemian roślinności na podstawie teorii synantropizacji i teorii syndynamiki. In Prace Geograficzne; IGiPZ PAN: Warszawa, Poland, 2001; Volume 179, pp. 31–52. [Google Scholar]
- Kurus, J.; Podstawka-Chmielewska, E. Struktura flory po dziesięcioletnim odłogowaniu gruntu ornego na dwóch typach gleb [Structure of flora after ten years land lying fallow on two types of soil]. Acta Agrobot. 2006, 59, 365–376. [Google Scholar] [CrossRef] [Green Version]
- Ratyńska, H. Wyspy środowiskowe jako element krajobrazu, próba typologii i zróżnicowanie szaty roślinnej. In Wyspy śRodowiskowe. Bioróżnorodność i próBa Typologii; Banaszek, J., Ed.; Wyd. Akademii Bydgoskiej im. K. Wielkiego: Bydgoszcz, Poland, 2002; pp. 239–260. [Google Scholar]
- Matysiak, A. Porownanie roslinnosci terenow porolnych zalesionych i pozostawionych naturalnej sukcesji w Kampinoskim Parku Narodowym. Przegląd Przyr. 2007, XVIII, 109–191. [Google Scholar]
- Krysiak, S. Odłogi jako element potencjału rekreacyjnego w strefie nadpilicznych parków krajobrazowych. Probl. Ekol. Kraj. 2012, XXXIV, 141–148. [Google Scholar]
- Wiluś, R. Rozwój funkcji turystycznej w dolinie rzeki Warty na odcinku od Działoszyna do Uniejowa. In Szlakami Nauki; ŁTN: Łódź, Poland, 1997; Volume 24, pp. 1–218. [Google Scholar]
- Wojciechowska, J. Kolonizacja turystyczna terenów nadpilicznych. In Szlakami Nauki; ŁTN: Łódź, Poland, 1998; Volume 26, pp. 1–159. [Google Scholar]
- Krysiak, S. Transformacja krajobrazów wiejskich regionu łódzkiego pod wpływem rozwoju funkcji turystycznych. Transformation of rural landscapes in the Łódź region by influence of the tourist functions development. Probl. Ekol. Kraj. 2010, XXVII, 231–237. [Google Scholar]
- Krysiak, S. Rola odłogów i terenów rekreacyjnych we współczesnych przemianach krajobrazów wiejskich regionu łódzkiego. In Studia Obszarów Wiejskich; IGiPZ PAN: Warszawa, Poland, 2014; Volume XXXV, pp. 75–87. [Google Scholar]
- Kussul, N.; Lavreniuk, M.; Skakun, S.; Shelestov, A. Deep Learning Classification of Land Cover and Crop Types Using Remote Sensing Data. IEEE Geosci. Remote Sens. Lett. 2017, 14, 778–782. [Google Scholar] [CrossRef]
- Kamilaris, A.; Prenafeta-Boldú, F.X. A review of the use of convolutional neural networks in agriculture. J. Agric. Sci. 2018, 156, 312–322. [Google Scholar] [CrossRef] [Green Version]
- NASA. Landsat 8. Landsat Science. Available online: https://landsat.gsfc.nasa.gov/landsat-8/ (accessed on 11 November 2019).
- ESA. Sentinel-2—ESA Operational EO Missions—Earth Online—ESA. Available online: https://earth.esa.int/web/guest/missions/esa-operational-eo-missions/sentinel-2 (accessed on 11 November 2019).
- Chen, Y.; Lin, Z.; Zhao, X.; Wang, G.; Gu, Y. Deep Learning-Based Classification of Hyperspectral Data. IEEE J. Sel. Top. Appl. Earth Obs. Remote Sens. 2014, 7, 2094–2107. [Google Scholar] [CrossRef]
- Luus, F.P.S.; Salmon, B.P.; van den Bergh, F.; Maharaj, B.T.J. Multiview Deep Learning for Land-Use Classification. IEEE Geosci. Remote Sens. Lett. 2015, 12, 2448–2452. [Google Scholar] [CrossRef] [Green Version]
- Lu, H.Z.; Fu, X.; Liu, C.; Li, L.; He, Y.x.; Li, N.W. Cultivated land information extraction in UAV imagery based on deep convolutional neural network and transfer learning. J. Mt. Sci. 2017, 14, 731–741. [Google Scholar] [CrossRef]
- Guidici, D.; Clark, M.L. One-Dimensional Convolutional Neural Network Land-Cover Classification of Multi-Seasonal Hyperspectral Imagery in the San Francisco Bay Area, California. Remote Sens. 2017, 9, 629. [Google Scholar] [CrossRef] [Green Version]
- Rußwurm, M.; Körner, M. Multi-Temporal Land Cover Classification With Long Short-Term Memory Neural Networks. Int. Arch. Photogramm. Remote Sens. Spat. Inf. Sci. 2017, 42, 551. [Google Scholar]
- Li, C.; Yang, S.X.; Yang, Y.; Gao, H.; Zhao, J.; Qu, X.; Wang, Y.; Yao, D.; Gao, J. Hyperspectral Remote Sensing Image Classification Based on Maximum Overlap Pooling Convolutional Neural Network. Sensors 2018, 18, 3587. [Google Scholar] [CrossRef] [Green Version]
- Krizhevsky, A.; Sutskever, I.; Hinton, G.E. ImageNet Classification with Deep Convolutional Neural Networks. Commun. ACM 2012, 60, 84–90. [Google Scholar] [CrossRef]
- Szegedy, C.; Liu, W.; Jia, Y.; Sermanet, P.; Reed, S.E.; Anguelov, D.; Erhan, D.; Vanhoucke, V.; Rabinovich, A. Going deeper with convolutions. In Proceedings of the 2015 IEEE Conference on Computer Vision and Pattern Recognition (CVPR), Boston, MA, USA, 7–12 June 2015; pp. 1–9. [Google Scholar]
- Carranza-García, M.; García-Gutiérrez, J.; Santos, J.C.R. A Framework for Evaluating Land Use and Land Cover Classification Using Convolutional Neural Networks. Remote Sens. 2019, 11, 274. [Google Scholar] [CrossRef] [Green Version]
- Wu, P.; Yin, Z.; Yang, C.; Wu, Y.; Ma, X. Reconstructing Geostationary Satellite Land Surface Temperature Imagery Based on a Multiscale Feature Connected Convolutional Neural Network. Remote Sens. 2019, 11, 300. [Google Scholar] [CrossRef] [Green Version]
- Torbick, N.; Huang, X.; Ziniti, B.; Johnson, D.; Masek, J.; Reba, M.L. Fusion of Moderate Resolution Earth Observations for Operational Crop Type Mapping. Remote Sens. 2018, 10, 1058. [Google Scholar] [CrossRef] [Green Version]
- Windrim, L.; Melkumyan, A.; Murphy, R.J.; Chlingaryan, A.; Ramakrishnan, R. Pretraining for Hyperspectral Convolutional Neural Network Classification. IEEE Trans. Geosci. Remote Sens. 2018, 56, 2798–2810. [Google Scholar] [CrossRef]
- Geoportal of Lodzkie Region, “Maps of Soil and Agricultural and Geological Portal”. 2019. Available online: https://geoportal.lodzkie.pl/imap/?locale=en (accessed on 1 October 2019).
- Sinergise Ltd. Modified Copernicus Sentinel Data 2019/Sentinel Hub. Available online: https://www.sentinel-hub.com/ (accessed on 3 October 2019).
- Sentinelhub-py. 2019. Available online: https://github.com/sentinel-hub/sentinelhub-py (accessed on 3 October 2019).
- Majchrowska, A. Abandoned lands around the Łódź Hills Landscape Park and the Bolimów Landscape. In The Ecological Role of Abandoned Agricultural Lands in Buffer Zones Around Landscape Parks in the Łódź Voivodeship; Krysiak, S., Adamczyk, J., Eds.; Wydawnictwo Uniwersytetu Łódzkiego: Łódź, Poland, 2016; pp. 30–41. [Google Scholar]
- Bański, J. Obszary Problemowe W Rolnictwie Polski; IGiPZ PAN: Warszawa, Poland, 1999; pp. 1–128. [Google Scholar]
- Kurkowski, S.; Popielski, W. Gorzkowice sheet. In Szczegółowa Mapa Geologiczna Polski 1:50000; Wydawnictwa Geologiczne: Warszawa, Poland, 1986. [Google Scholar]
- Krysiak, S. Typy geokompleksów i kierunki ich użytkowania w środkowej części dorzecza Pilicy. Acta Geogr. Lodz. 1999, 75, 1–214. [Google Scholar]
- Krysiak, S. Waloryzacja geokompleksow Polski Srodkowej na podstawie badan krajobrazowych i badan wlasciwosci fizycznych i chemicznych utworow powierzchniowych. Zesz. Probl. Postępów Nauk Rol. 2005, 507, 295–306. [Google Scholar]
- Papińska, E. Cechy siedlisk terenów odłogowanych w strefie otaczającej Park Krajobrazowy Międzyrzecza Warty i Widawki. Probl. Ekol. Kraj. 2014, XXXVII, 121–130. [Google Scholar]
- Adamczyk, J.; Krysiak, S.; Sieradzki, J. Abandoned land study plot groups in the buffer zone around landscape parks on the Pilica River. In The Ecological Role of Abandoned Agricultural Lands in Buffer Zones Around Landscape Parks in the Łódź Voivodeship; Krysiak, S., Adamczyk, J., Eds.; Wydawnictwo Uniwersytetu Łódzkiego: Łódź, Poland, 2016; pp. 42–71. [Google Scholar]
- Krysiak, S. Abandoned lands around landscape parks on the Pilica River (Przedbórz Landscape Park, Sulejów Landscape Park, Spała Landscape Park). In The Ecological Role of Abandoned Agricultural Lands in Buffer Zones Around Landscape Parks in the Łódź Voivodeship; Krysiak, S., Adamczyk, J., Eds.; Wydawnictwo Uniwersytetu Łódzkiego: Łódź, Poland, 2016; pp. 15–21. [Google Scholar]
- Majchrowska, A.; Adamczyk, J.; Sieradzki, J. Abandoned land study plot groups in the buffer zones around the Bolimów Landscape Parks and the Łódź Hills Landscape Park . In The Ecological Role of Abandoned Agricultural Lands in Buffer Zones Around Landscape Parks in the Łódź Voivodeship; Krysiak, S., Adamczyk, J., Eds.; Wydawnictwo Uniwersytetu Łódzkiego: Łódź, Poland, 2016; pp. 99–126. [Google Scholar]
- Papińska, E.; Adamczyk, J.; Sieradzki, J. Abandoned land study plot groups in the buffer zone around the Sieradz landscape parks. In The Ecological Role of Abandoned Agricultural Lands in Buffer Zones Around Landscape Parks in the Łódź Voivodeship; Krysiak, S., Adamczyk, J., Eds.; Wydawnictwo Uniwersytetu Łódzkiego: Łódź, Poland, 2016; pp. 72–98. [Google Scholar]
- Szymczyk, M.; Krysiak, S. Przemiany krajobrazu doliny Luciąży i jej otoczenia po utworzeniu zbiornika retencyjnego Cieszanowice. Acta Univ. Lodz. Folia Geogr. Phys. 2018, 17, 41–50. [Google Scholar] [CrossRef] [Green Version]
- Wągrowski, S. Rzejowice sheet. In Szczegółowa Mapa Geologiczna Polski 1:50000; Wydawnictwa Geologiczne: Warszawa, Poland, 1983. [Google Scholar]
- Krysiak, S. The influence of periglacial cover deposits upon aeration and moisture conditions of geocomplexes. Biul. Peryglac. 1996, 35, 87–120. [Google Scholar]
- Isola, P.; Zhu, J.Y.; Zhou, T.; Efros, A.A. Image-to-Image Translation with Conditional Adversarial Networks. arXiv 2018, arXiv:1611.07004. [Google Scholar]
- Huynh, D.N.T.; Neptune, N. Annotation automatique d’images: Le cas de la déforestation. CORIA 2018. [Google Scholar] [CrossRef]
Figure 1.
Research area in the geographic context of Poland.

Figure 2.
Model training flowchart.

Figure 3.
Sample portion of a research area. Bounding boxes are superimposed over their respective grid elements.
Figure 3.
Sample portion of a research area. Bounding boxes are superimposed over their respective grid elements.

Figure 4.
Time series of a single grid element classified as null-grade abandoned land. Original data class 0. The data sample is presented in RGB and near-infrared channels.
Figure 4.
Time series of a single grid element classified as null-grade abandoned land. Original data class 0. The data sample is presented in RGB and near-infrared channels.

Figure 5.
Time series of a single grid element classified as abandoned land. Original data class 4. The data sample is presented in RGB and near-infrared channels.
Figure 5.
Time series of a single grid element classified as abandoned land. Original data class 4. The data sample is presented in RGB and near-infrared channels.

Figure 6.
Convolutional network architecture for land abandonment classification.

Figure 7.
Probability distribution map of land abandonment across the Łódź Voivodeship.

Figure 8.
Heatmap with cold- and hotspots of a surface area greater than 50 km2.

Figure 9.
The occurrence of conditions of and contributing factors to the presence of identified land abandonment cold- and hotspots: 1—soil conditions; 2—landscape; 3—vicinity of roads and/or interchanges; 4—urbanization and suburbanization; 5—vicinity of forests; 6—surroundings of mineral exploitation sites.

Figure 10.
Abandoned postagricultural land in the “Cieszanowice” unit, superimposed over land abandonment probability classes (hotspot B).
Figure 10.
Abandoned postagricultural land in the “Cieszanowice” unit, superimposed over land abandonment probability classes (hotspot B).

Figure 11.
Abandoned postagricultural land in the “Dmenin” unit, superimposed over abandonment probability classes (coldspot f).
Figure 11.
Abandoned postagricultural land in the “Dmenin” unit, superimposed over abandonment probability classes (coldspot f).


Table 1.
The confusion matrix under the test set.
| Prediction/Classification | Nonabandoned | Abandoned |
|---|---|---|
| nonabandoned | 22,556 | 3496 |
| abandoned | 6328 | 12,219 |
Table 2.
Hotspots.
| Symbol in Figure 8 | Name | Location | Surface in km2 |
|---|---|---|---|
| A | Central | Surrounding Łódź, Zgierz, Zelów, Szczerców, and the Szczerców Field of Bełchatów Lignite Mine, areas along the Warta river from the vicinity of Strońsk, through Chojne, until the southernmost suburbs of Sieradz and the vicinity of Hipolitów on the Pisia river | 2025.25 |
| B | Kamieńsk | East of Bełchatów, southwest of forest complexes and Gomunice, spanning along the railway from Radomsko towards Kamieńsk and subsequently northwards of the Widawka river valley | 292.5 |
| C | Grębienice | Southeast of the Łódź voivodeship, near Grębienice-Nowa Góra, and south of Żarnów | 254.5 |
| D | Tomaszów Mazowiecki | Along the Plica river valley and near the Spalski and Sulejowski Landscape Parks | 238 |
| E | Gidle | Southern Łódź voivodeship, stretches North–South along the Warta and Stara Wiercica river valleys | 158 |
| F | Skierniewice Interchange | Along the western border of the Bolimów Landscape Park and near sparsely forested areas, enveloping the A2 motorway | 147.75 |
| G | Struga Węglewska | SW portion of the Łódź Voivodeship, interfluve of Struga Kraszewicka, Struga Węglewska, and Prosna rivers. NE from Wieruszów | 138.75 |
| H | Ożegów-Rząśnia | Neighborhood of the Oźegów and Rząśnia localities, stretching east to west | 117 |
| I | Rawa | South of Rawa Mazowiecka and the upper Rawka and Rylka river valleys, stretching latitudinally | 110.5 |
| J | Działoszyn | South of the Warta river, chiefly east of Grabia river, extending towards Działoszyn and subsequently curving in the SE direction | 101.25 |
| K | Nowy Dwór | Stretching longitudinally on the E side of the Rawka valley and along the Białka valley | 90.25 |
| L | Strobin | Running NW–SE between the localities of Oleśnica and Osina | 88 |
| M | Drzewica | Extending alongside the eastern border of the voivodeship, between the Ossa and Rozwady villages, centered on the Drzewica locality | 71.75 |
| N | Petrykozy | Near the voivodeship’s eastern border, SE of Opoczno, along the Młynkowska and Drzewiczka river valleys, centered on Petrykozy | 59.75 |
| O | Grabina | Between the Pichna and Urszulinka rivers, westward of Zadzim | 53.25 |
| P | Kliczków | Stretches latitudinally between the Izabela and Kije localities | 50.5 |
Table 3.
Coldspots.
| Symbol in Figure 8 | Name | Location | Surface in km2 |
|---|---|---|---|
| a | Northern | Mostly within the northern part of the voivodeship, including the Warsaw-Berlin Urstromtal and the surroundings of Ozorków, Łęczyca, extending towards Łowicz | 2055 |
| b | Piotrków Trybunalski | Elongated along the N–S axis, bounded by the Piasecznica valley from the north and the Bogdanówka valley from the south, centered on the localities of Moszczenica and Wolbórz | 554 |
| c | Wieluń | SW portion of the voivodeship, near Wieluń | 459.75 |
| d | Błaszki-Warta | West of the Warta valley, in the vicinity of the Jeziorsko reservoir, delimited by the voivodeship’s western border. Highly contiguous | 429.75 |
| e | Jeżów | Centered on Jeżów | 372.75 |
| f | Przedbórz-Radomsko | Elongated along the W–E axis, in the southern portion of the voivodeship, extending as far west as Radomsko and as far east as Przedbórz | 169.5 |
| g | Chodnów | Near Biała Rawska and Chodnów, to the east of the Central Rail Line, adjacent to the eastern border of the voivodeship | 164.75 |
| h | Szadek | Relatively compact, between the town of Szadek to the south and Poddębice to the north | 70.07 |
| i | Sadykierz | Bordering the Spalski Landscape Park’s forests southward and the Luboczanka valley northward. Contains the localities of Sadykierz and Rzeczyca | 66.50 |
© 2020 by the authors. Licensee MDPI, Basel, Switzerland. This article is an open access article distributed under the terms and conditions of the Creative Commons Attribution (CC BY) license (http://creativecommons.org/licenses/by/4.0/).
Share and Cite
MDPI and ACS Style
Krysiak, S.; Papińska, E.; Majchrowska, A.; Adamiak, M.; Koziarkiewicz, M. Detecting Land Abandonment in Łódź Voivodeship Using Convolutional Neural Networks. Land 2020, 9, 82. https://doi.org/10.3390/land9030082
AMA Style
Krysiak S, Papińska E, Majchrowska A, Adamiak M, Koziarkiewicz M. Detecting Land Abandonment in Łódź Voivodeship Using Convolutional Neural Networks. Land. 2020; 9(3):82. https://doi.org/10.3390/land9030082
Chicago/Turabian StyleKrysiak, Stanisław, Elżbieta Papińska, Anna Majchrowska, Maciej Adamiak, and Mikołaj Koziarkiewicz. 2020. "Detecting Land Abandonment in Łódź Voivodeship Using Convolutional Neural Networks" Land 9, no. 3: 82. https://doi.org/10.3390/land9030082
Note that from the first issue of 2016, this journal uses article numbers instead of page numbers. See further details here.